Toward 3D hedonic price model for vertically developed cities using street view images and machine learning methods
Abstract
The vertical developments in cities reshape the urban form and structure, and the influences on human liveability can be reflected by the variations in property values. The hedonic price model (HPM) is commonly employed in city-scale property valuation to unravel the hedonic values of different influential variables. In vertically developed cities, it necessitates the exploration of the hedonic value in the vertical dimension (3D), which was previously under-researched due to limited 3D data and the complexity of processing techniques. Recent studies use eye-level street view images (SVIs) for valuation, but the 3D perspective is still missing. This study proposes a novel 3D property valuation method using SVIs acquired from two angles, eye-level (pitch 0°) and sky-view (pitch 90°, upwards), and machine learning method to complete the 3D perspective and provide explainability of 3D HPM. We also compared different valuation models – namely Ordinary Least Square (OLS), Geographically Weighted Regression (GWR), and Random Forest (RF) – using model performance metrics. Our main findings include 1) 3D variables are statistically significant, and adding them improves the model performance (R2 from 0.580 to 0.636 in GWR); 2) In the sky-view angle, the proportion of sky has a positive correlation while the presence of buildings and trees are negatively correlated with property values; 3) RF outperforms OLS and GWR with the highest R2 (0.768) and the least RMSE (1669.60 yuan/m2), which demonstrates its robust explainability and applicability for valuation. This study enriches the property valuation literature on the significance of the 3D variables and provides references to guide fair taxation and equal land use policy in vertically developed cities.
Data Collection
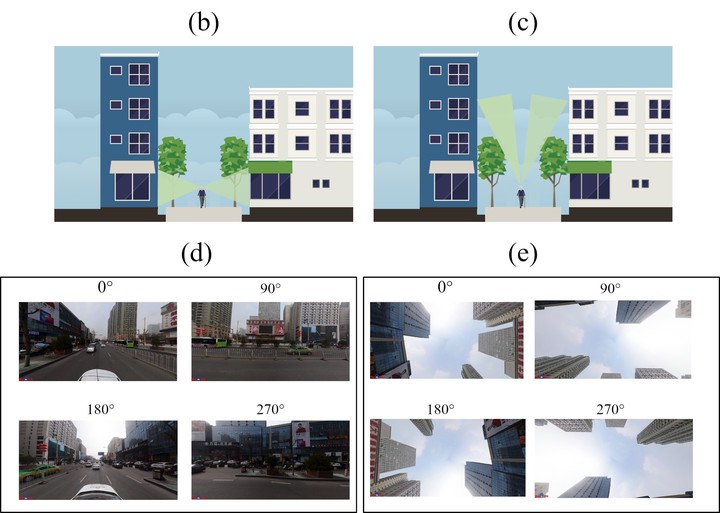
The workflow of mass-downloading SVIs started with generating the sampling points with an interval of 10 m along the OpenStreetMap (https://www.openstreetmap.org) road networks (Figure 1a). Second, we determined the heading direction and pitch, two parameters in image customisation (Figure 1b and c). Heading direction defines the compass heading of the camera with the value from 0° to 360°. Four heading directions (0°, 90°, 180°, 270°) were selected for a full surrounding view. The pitch represents the up/down angle at which the street view is taken. Compared to other studies that adopt pitch 0° for eye-level only, our strategy incorporates two pitches (0° and 90°) to collect both eye-level images reflecting horizontal streetscape and sky-view images reflecting the vertical sky openness (Figure 1d and e). Finally, we determined the acquisition time: 2019 or 2020. Our objective is to improve the quantity of SVIs by employing a compact sampling point density and a comparatively inclusive acquisition timeframe. Preliminary assessments indicated that not all sampling points have images, and annual updates are not guaranteed. Ideally, if images are available, eight images are collected per year per sampling point. Each image has 1024 ∗ 512 pixels. In total, we generated 83,925 sampling points and downloaded 737,704 images.

Figure 1. Distribution of sampling points along the road network, the abstract simulations of eye-level angle and sky-view angles, and illustrations of SVI in eye-level angle and sky-view angle (a)-(e).
Proposed 3D hedonic price model
As shown in Figure 2, this study is conducted within the HPM framework, which consists of three steps. We first generate physical, locational variables, extract 3D variables from SVIs, and then construct HPM in different valuation models, namely OLS, GWR and RF.
$$V=f(P,L,E_{3d})$$

Figure 2. The methodology design and the workflow of 3D hedonic price model (3D HPM).

Figure 3. The example of semantic segmentation
RF performs the best among all three models. $R^2$ increases from 0.716 to 0.768 by adding 3D variables. In addition to R2 values, RMSE, MAE, and MAPE are also used to evaluate the model accuracy, as shown in Table 3. The lowest RMSE in RF is 1669.60 $yuan/m^2$. Taking the average property value (14,318 $yuan/m^2$), the MAPE of estimation in RF is 11.66%. In summary, OLS has the basic performance, GWR has improvement, and RF has the best explainability and the least errors in different regards.
Table 1. The comparison of $R^2$, RMSE, MAE and MAPE among different models (based on group 4). The unit of RMSE and MAE: $yuan/m^2$.
| Indicator | OLS | GWR | RF | |
|---|---|---|---|---|
| R2 | 0.376 | 0.636 | 0.768 | |
| RMSE | 3116.65 | 2331.41 | 1669.60 | |
| MAE | 2199.91 | 1582.27 | 1006.63 | |
| MAPE | 0.16 | 0.11 | 0.08 |
Figure 4 gives an overview of 3Dss in GWR. The distribution of 3Dss has a trend of expansion from the centre towards the periphery (Figure 4c and d). The city centre of Xi’an has narrow street width and densely distributed buildings. The north and west peripheries have improved urban design with broader roads and more sky exposure. The distribution of its coefficients has a similar tendency (Figure 4a). In the centre, 3Dss has negative values. The fact shows that the presence of sky is not favoured for higher property values. The negativity reduces and eventually becomes positive as it gets farther from the centre. Figure 4b shows the distribution of the p value of 3Dss, indicating the geographical coverage when 3Dss is statistical significant.

Figure 4. The distribution of 3Dss in GWR model: coefficient, p value, variable itsel, and 3D visualisation (a)-(d).
Figure 5 displays the relative importance of all the variables. Among the 3D variables, road, tree and grass from eye-level images are the top three influential variables with values of 1, 0.619 and 0.541. Sky from sky-view images ranks fourth (0.432) in the total and first in sky-view variables. Building from sky-view images closely follows with a value of 0.411. The sequence of other 3D variables is as follows: building (0.369), sky (0.361), sidewalk (0.327) in eye-level images, separately. Tree in sky-view images, has the least value (0.26) among 3D variables, but it is still ahead of several physical and locational variables.

Figure 5. The relative importance of variables in Random Forest (RF) model.
Figure 6 illustrates the PDPs of all 3D variables. 3Det, 3Deg, 3Der, 3Dss, and 3Dsb share a similar pattern. In the early stage, there is hardly an impact on property values; then, the influence becomes obvious after a certain value. After reaching another value, the impact again becomes insignificant. Certain values vary among different variables. In eye-level images, tree starts at 0.10 and ends at 0.15; grass starts at 0.08 and ends at 0.22, road starts at 0.23 and ends at 0.26. In sky-view images, sky starts at 0.30 and ends at 0.65, building starts at 0.06 and ends at 0.12.

Figure 6. The partial dependence plots (PDPs) of 3D variables.
Conclusion
With the spatial changes happening in the vertical direction in cities because of the construction of high-rise buildings, it is necessary to conceptually and technically identify the hedonic value of 3D and add 3D variables in HPM for property valuation. Our empirical results show: 1) 3D variables have made significant contributions to HPM, and the sky-view angle cannot be overlooked. 2) In the sky-view angle, sky is positively correlated while the presence of buildings and trees are negatively correlated with property values. The influence direction of building and tree are different in eye-level and sky-view images, which further reminds the importance of sky-view angle. 3) RF outperforms OLS and GWR regarding a higher model fitting and stronger explainability power to interpret the influences of 3D variables. The study confirms the important role of 3D in HPM in the context of vertically developed cities with generous amounts of high-rise buildings. Our findings are expected to provide consultancy value for housing policy-making, such as fair property taxation and equal land use policy. In conclusion, this study provides solid evidences that SVIs and AI can quantify the 3D built environment at a low cost on a mass scale (technically feasible), and the sky-view angle is meaningful in valuation practices in vertical cities (practically significant), laying a foundation for future 3D property valuation.