Investigating the Uncertainties Propagation Analysis of CO$_2$ Emissions Gridded Maps at the Urban Scale: A Case Study of Jinjiang City, China
Abstract
Gridded CO$_2$ emission maps at the urban scale can aid the design of low-carbon development strategies. However, the large uncertainties associated with such maps increase policy-related risks. Therefore, an investigation of the uncertainties in gridded maps at the urban scale is essential. This study proposed an analytic workflow to assess uncertainty propagation during the gridding process. Gridded CO$_2$ emission maps were produced using two resolutions of geospatial datasets (e.g., remote sensing satellite-derived products) for Jinjiang City, China, and a workflow was applied to analyze uncertainties. The workflow involved four submodules that can be used to evaluate the uncertainties of CO$_2$ emissions in gridded maps, caused by the gridded model and input. Fine-resolution (30 m) maps have a larger spatial variation in CO$_2$ emissions, which gives the fine-resolution maps a higher degree of uncertainty propagation. Furthermore, the uncertainties of gridded CO$_2$ emission maps, caused by inserting a random error into spatial proxies, were found to decrease after the gridding process. This can be explained by the “compensation of error” phenomenon, which may be attributed to the cancellation of the overestimated and underestimated values among the different sectors at the same grid. This indicates a nonlinear change between the sum of the uncertainties for different sectors and the actual uncertainties in the gridded maps. In conclusion, the present workflow determined uncertainties were caused by the gridded model and input. These results may aid decision-makers in establishing emission reduction targets, and in developing both low-carbon cities and community policies.
Graphical abstract
Highlights
- A proposed workflow to analyze the uncertainties caused by gridded model and model input.
- Fine-resolution (30 m) maps have a larger spatial variation in CO$_2$ emissions, which gives the fine-resolution maps a higher degree of uncertainty propagation.
- This indicates a nonlinear change between the sum of the uncertainties for different sectors and the actual uncertainties in the gridded maps.
- The nonlinear change can be explained by the “compensation of error” phenomenon.
Overview
Estimating $CO_2$ emissions at the urban scale, including both un-gridded (i.e., administrative unit maps) and gridded maps, cannot avoid the propagation of uncertainties from input to result, which highlights the importance of being aware of uncertainty estimation, especially in gridded maps due to its implications for the precision mitigation of $CO_2$ emissions.
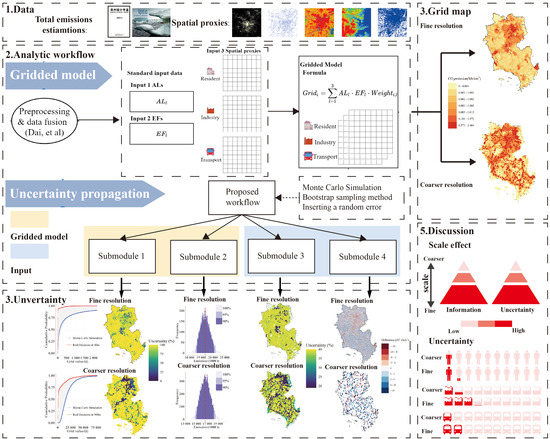
To address the above mentioned issue, an analytic workflow was proposed to analyze the propagated uncertainties caused by the gridded model and the input for gridded $CO_2$ emission maps. The present workflow used four sub-modules based on Monte Carlo simulations and a bootstrap sampling method to analyze uncertainties, without other detailed open emission inventories. Two of the submodules obtained the corresponding uncertainty of each grid value, generated the uncertainty map caused by the gridded model, and the uncertainties for the sum of each cell (also referred to as propagated uncertainties caused by the model); the other submodules generated the uncertainty distribution maps based on the total emission estimations and spatial proxies (also referred to as propagated uncertainties caused by input).
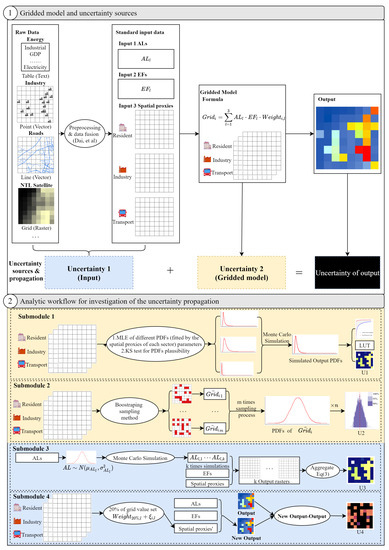
Figure 1 Analytic workflow of the uncertainty propagation in gridded $CO_2$ emission maps. ALs, activity levels; CI, confidence interval; EFs, emission factors; GDP, gross domestic product; KS, Kolmogorov–Smirnov; LUT, look up table; MLE, maximum likelihood estimation; NTL, night time light; PDFs, probability distribution functions.
Results
We regarded the gridded maps of $CO_2$ emissions constructed in previous studies as a case study, and applied the workflow to estimate the uncertainties. The estimation of different uncertainties helps decision makers in formulating relevant policies. Uncertainties in total emission estimations aid the determination of emission reduction targets, the corresponding risks for cities and enterprises, and significant emission sources. Uncertainty maps could help to identify locations suitable for developing low-carbon communities. Fine-resolution (30 m) maps have a larger spatial variation in $CO_2$ emissions, which gives the fine-resolution maps a higher degree of uncertainty propagation. Furthermore, the uncertainties of gridded $CO_2$ emission maps, caused by inserting a random error into spatial proxies, were found to decrease after the gridding process. This can be explained by the “compensation of error” phenomenon, which may be attributed to the cancellation of the overestimated and underestimated values among the different sectors at the same grid. This indicates a nonlinear change between the sum of the uncertainties for different sectors and the actual uncertainties in the gridded maps.
U1
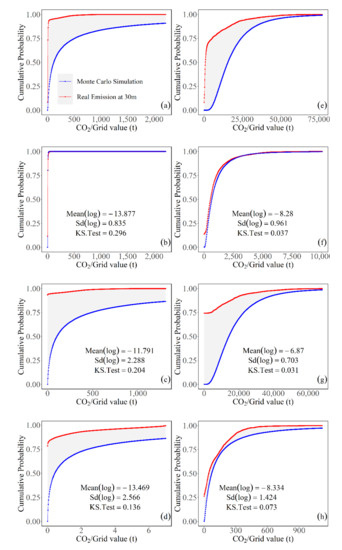
Figure 2 CDF curve of different $CO_2$ emissions at 30 m and 500 m resolution. The upper figures are at 30 m resolution, while the lower figures are at 500 m resolution. The red line is the distribution of the real values, while the blue line is the distribution of the simulated values. (a,e) are the total $CO_2$ emissions, (b,f) are the residential $CO_2$ emissions, (c,g) are the industrial $CO_2$ emissions, and (d,h) are the transport $CO_2$ emissions. KS., Kolmogorov–Smirnov; Sd, Standard deviation.
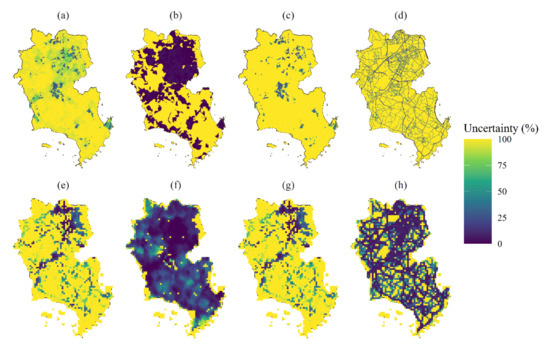
Figure 3 Uncertainty maps made by the gridded model of $CO_2$ emissions in Jinjiang city, at resolutions of 30 m (a–d) and 500 m (e–h). (a,e) show uncertainty maps of total $CO_2$ emissions. (b,f) show uncertainty maps of residential $CO_2$ emissions. (c,g) show uncertainty maps of industrial $CO_2$ emissions. (d,h) show uncertainty maps of transport $CO_2$ emissions.
U2
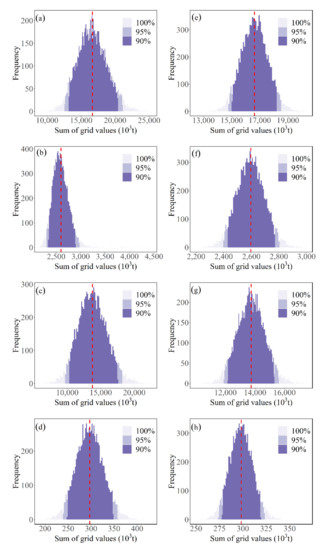
Figure 4 $CO_2$ emission population (statistic term) distributions of different sectors. The left figures are at 30 m resolution, while the right figures are at 500 m resolution. The red line is the distribution of the real values, and the blue line is the distribution of the simulated values. (a,e) are the total $CO_2$ emissions, (b,f) are the residential $CO_2$ emissions, (c,g) are the industrial $CO_2$ emissions, and (d,h) are the transport $CO_2$ emission.
U3
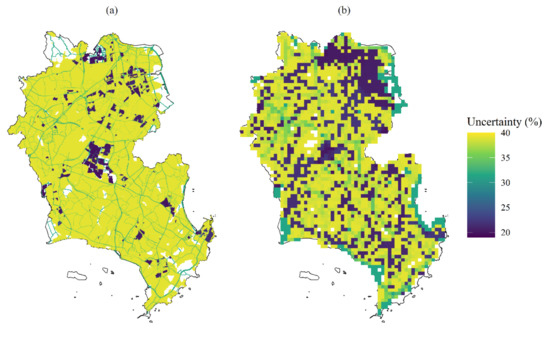
Figure 5 Map showing the uncertainty caused by activity levels. (a,b) represent the uncertainty maps of total $CO_2$ emissions at 30 m and 500 m resolution, respectively.
U4
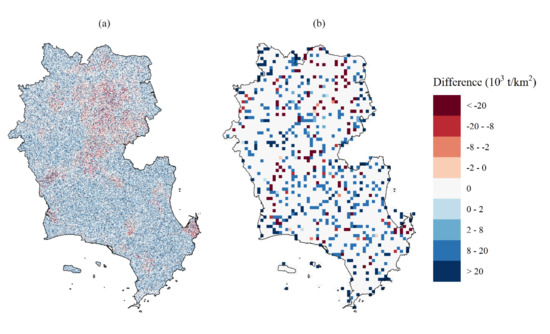
Figure 6 Maps of uncertainty caused by the spatial proxies. (a,b) represent the maps of uncertainty of total $CO_2$ emissions at 30 m and 500 m resolutions.