Improving Plot-Level Model of Forest Biomass: A Combined Approach Using Machine Learning with Spatial Statistics
Abstract
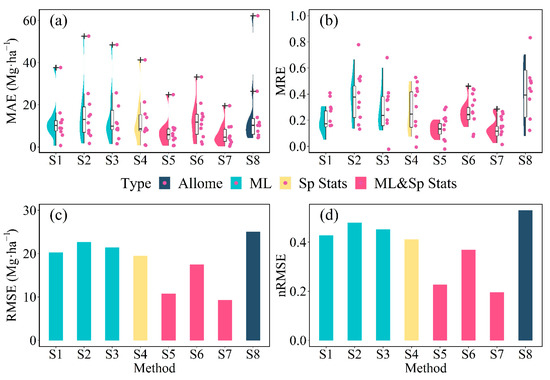
Estimating the aboveground biomass (AGB) at the plot level plays a major role in connecting accurate single-tree AGB measurements to relatively difficult regional AGB estimates. However, AGB estimates at the plot level suffer from many uncertainties. The goal of this study is to determine whether combining machine learning with spatial statistics reduces the uncertainty of plot-level AGB estimates. To illustrate this issue, this study evaluates and compares the performance of different models for estimating plot-level forest AGB. These models include three different machine learning models [support vector machine (SVM), random forest (RF), and a radial basis function artificial neural network (RBF-ANN)], one spatial statistic model (P-BSHADE), and three combinations thereof (SVM & P-BSHADE, RF & P-BSHADE, and RBF-ANN & P-BSHADE). The results show that the root mean square error, mean absolute error, and mean relative error of all combined models are substantially smaller than those of any individual model, with the RF & P-BSHADE combined method generating the smallest values. These results indicate that a combined approach using machine learning with spatial statistics, especially the RF & P-BSHADE model, improves the accuracy of plot-level AGB models. These research results contribute to the development of accurate large-forested-landscape AGB maps.

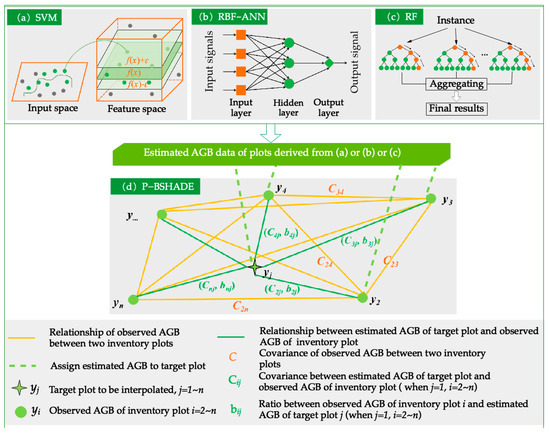
Figure 1 Framework for estimating (a–c) the machine learning models, (d) the P-BSHADE model, and the three models that combine machine learning with the P-BSHADE model ((a,d), (b,d) and (c,d)).

Figure 2 Prediction performance of the seven different models. (a) MAE and (b) MRE are presented as boxplots for each prediction method, with the median (black horizontal line in the box), interquartile range (25–75% in the box), range 5–95% (whiskers), and outliers (asterisks) labeled (S1 = SVM, S2 = RBF-ANN, S3 = RF, S4 = P-BSHADE, S5 = SVM & P-BSHADE, S6 = RBF-ANN & P-BSHADE, S7 = RF & P-BSHADE, S8 = allometric model, Allome = allometric model, ML = machine learning, and Sp Stats = spatial statistics). Histogram distributions of RMSE and nRMSE for each prediction method are presented in panels © and (d), respectively.

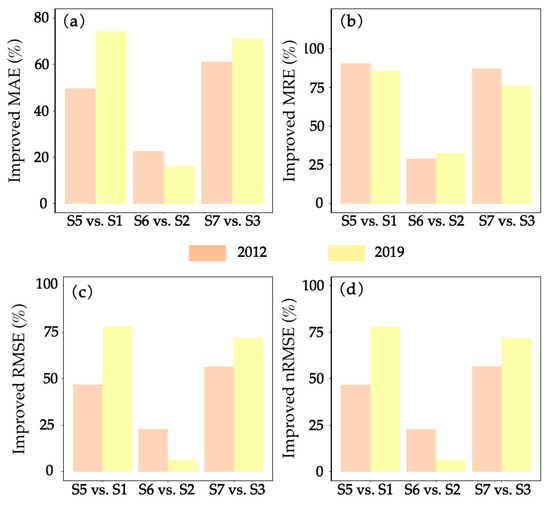
Figure 3 Improved accuracy assessment indexes of three combined machine learning and spatial statistical methods are revealed by comparison with three corresponding machine learning methods. Panels (a–d) show the MAE, MRE, RMSE, and nRMSE, respectively; S1 vs. S5 compares S5 with S1, S2 vs. S6 compares S6 with S2, and S3 vs. S7 compares S7 with S3 (S1 = SVM, S2 = RBF-ANN, S3 = RF, S5 = SVM & P-BSHADE, S6 = RBF-ANN & P-BSHADE, S7 = RF & P-BSHADE)
Forest AGB estimates at the plot level play a major role in connecting accurate single-tree AGB measurements to relatively difficult regional AGB estimates. However, AGB estimates at the plot level are plagued by numerous uncertainties. Improving the plot-level model of forest AGB is a key issue in producing accurate AGB maps. A variety of prediction models have been applied to make accurate AGB estimates, all of which have their own advantages and disadvantages. Different approaches complement the advantages of different models and may yield more accurate AGB estimates than would otherwise be produced by using a single method. The main goal of the current study was to determine whether combining machine learning with spatial statistics can improve plot-level AGB estimates.
This study explores the prediction performance of different AGB models, and the results show that the model combining the random forest and P-BSHADE models substantially improves the accuracy of the estimates of forest AGB. The results of this study suggest that combining machine learning with spatial statistics improves plot-level AGB estimates. The understanding gained here should help to improve AGB mapping in other regions and in different types of forests.