Air Pollution Map
Air pollution has become a global concern for public health and environmental governance, especially in developing countries. Accurate air pollution maps are the foundation of exposure assessment and policy evaluation. This project builds accurate, multi-scale air pollution maps from multi-source data and machine learning, explores the driving factors behind the observed spatiotemporal dynamics, and further links the maps to population exposure and health outcomes.
1 Driving factors of PM2.5 concentration
What drives the spatiotemporal dynamics of PM2.5? We applied the geographical detector technique to quantify the individual and interactive explanatory power of anthropogenic, ecological, and meteorological factors at different periods, and further analyzed the long-term changes in annual average PM2.5 concentrations across Yangtze River Delta cities between 2005 and 2015. The results reveal strong interactive effects among impact factors and an evident north–south gradient of concentration changes in the YRD region.
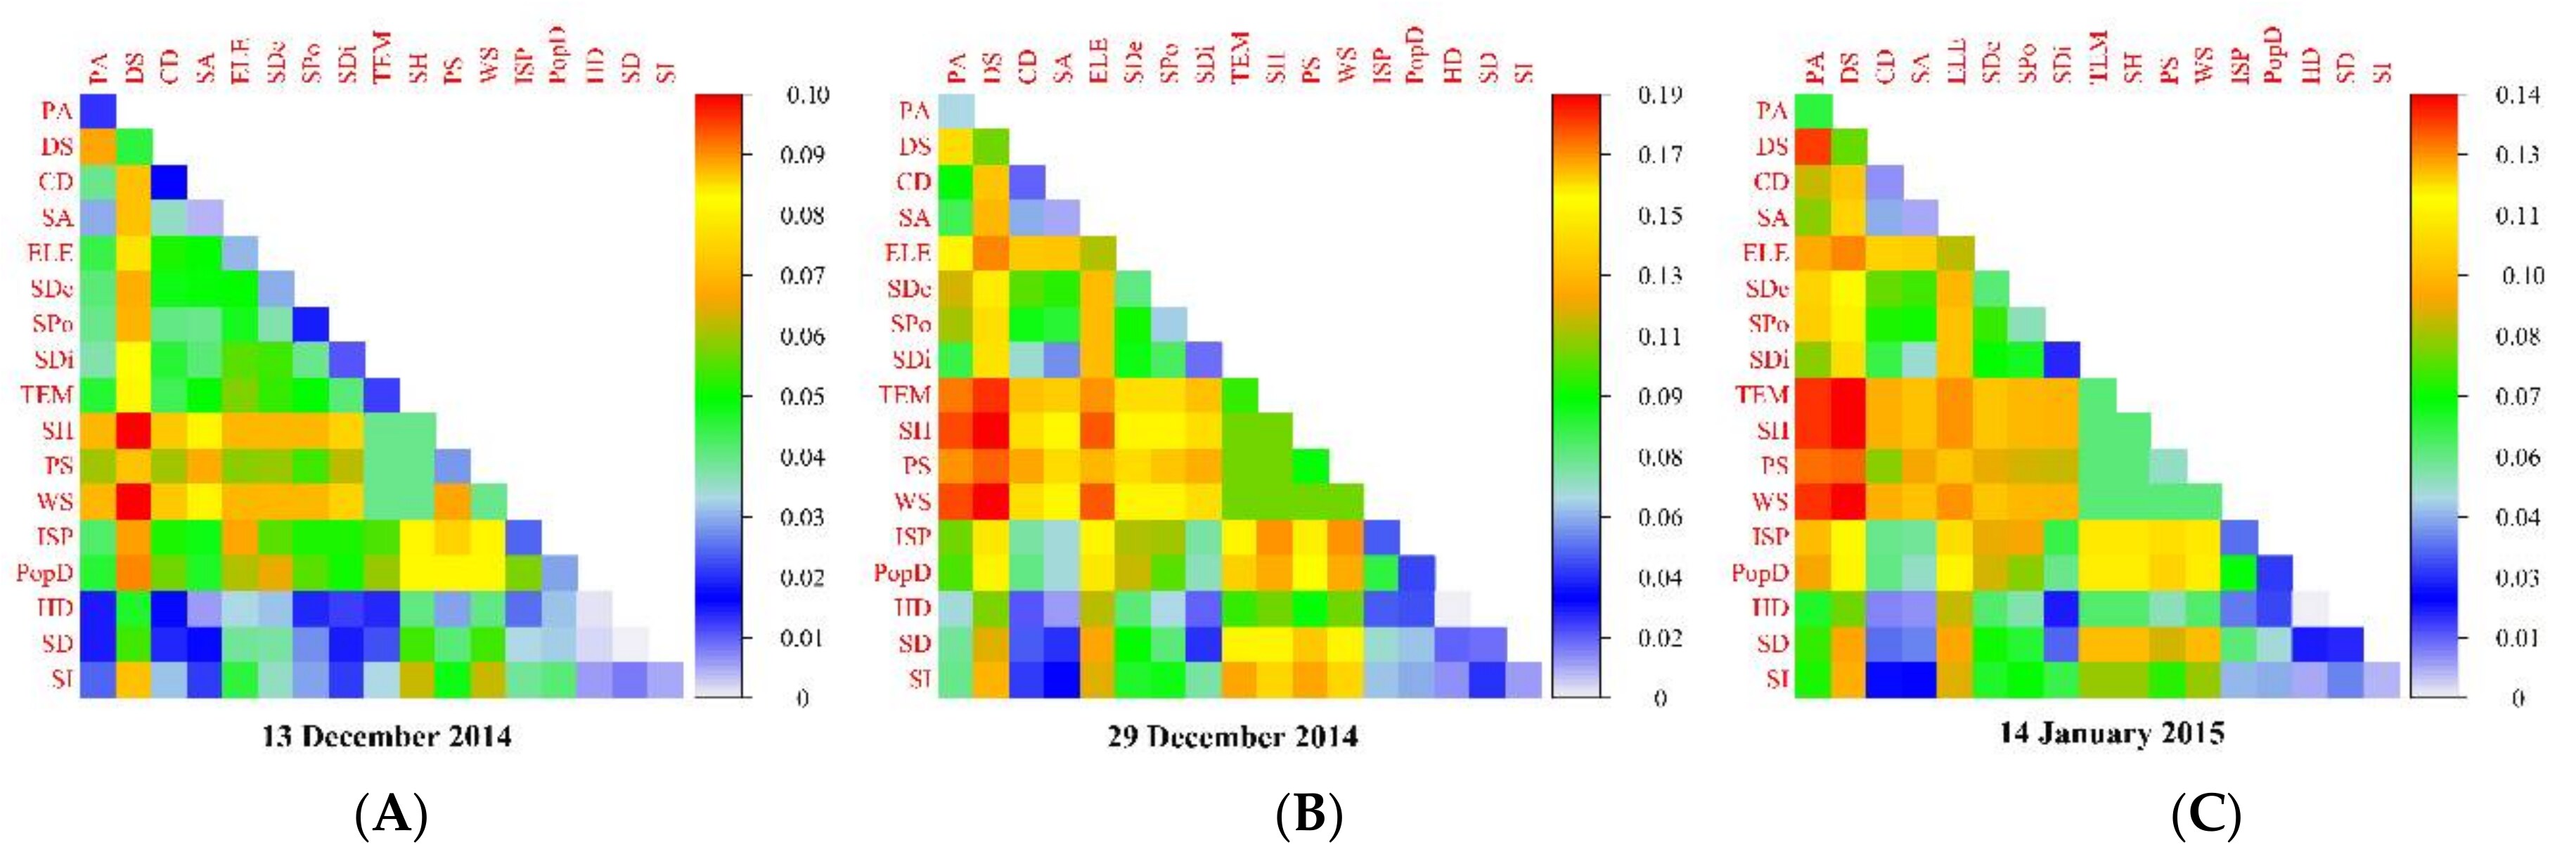
Figure 1. Scores for the interactive effects of impact factors sensitivity rankings at the three periods studied, calculated based on simulations using multisource data.
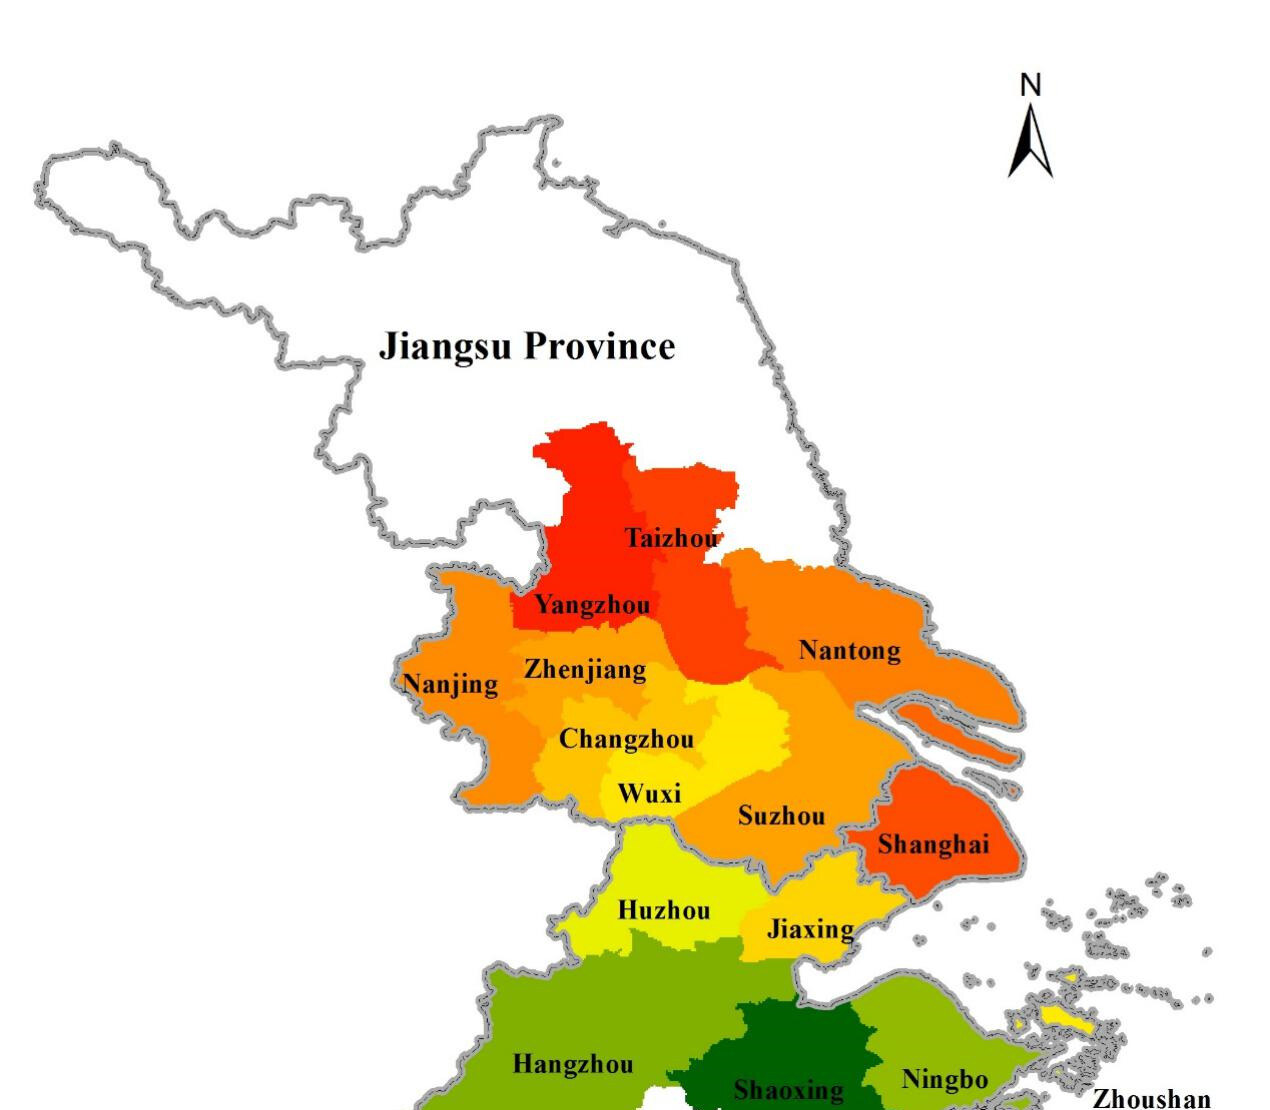
Figure 2. The spatial distribution of changes in annual average PM2.5 concentrations in different YRD cities from 2005 to 2015.
The geodetector study was published in Remote Sensing, and the YRD driver analysis was published in Atmosphere
2 Daily PM2.5 mapping at 1-km resolution
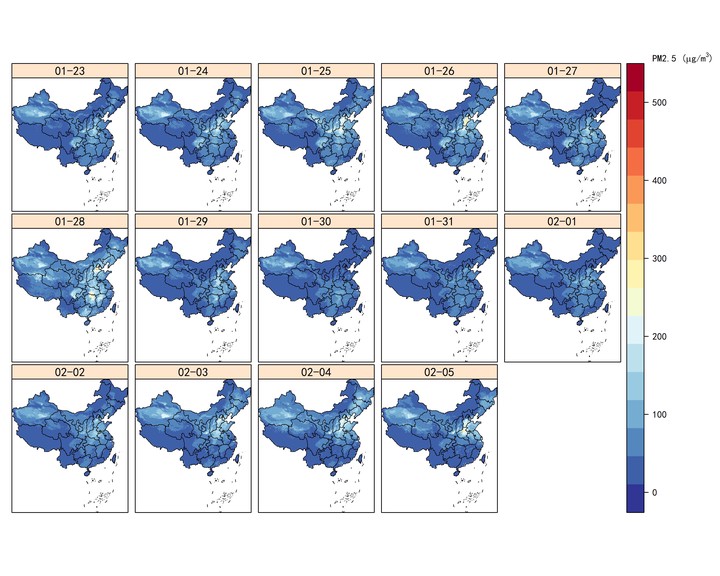
Station-based monitoring is too sparse to support exposure assessment. We developed a daily PM2.5 mapping approach at 1-km resolution that integrates remote sensing retrieval, meteorological fields, and land use regression, producing wall-to-wall concentration surfaces that capture day-to-day pollution dynamics, such as the heavy pollution episodes during the Spring Festival travel period.
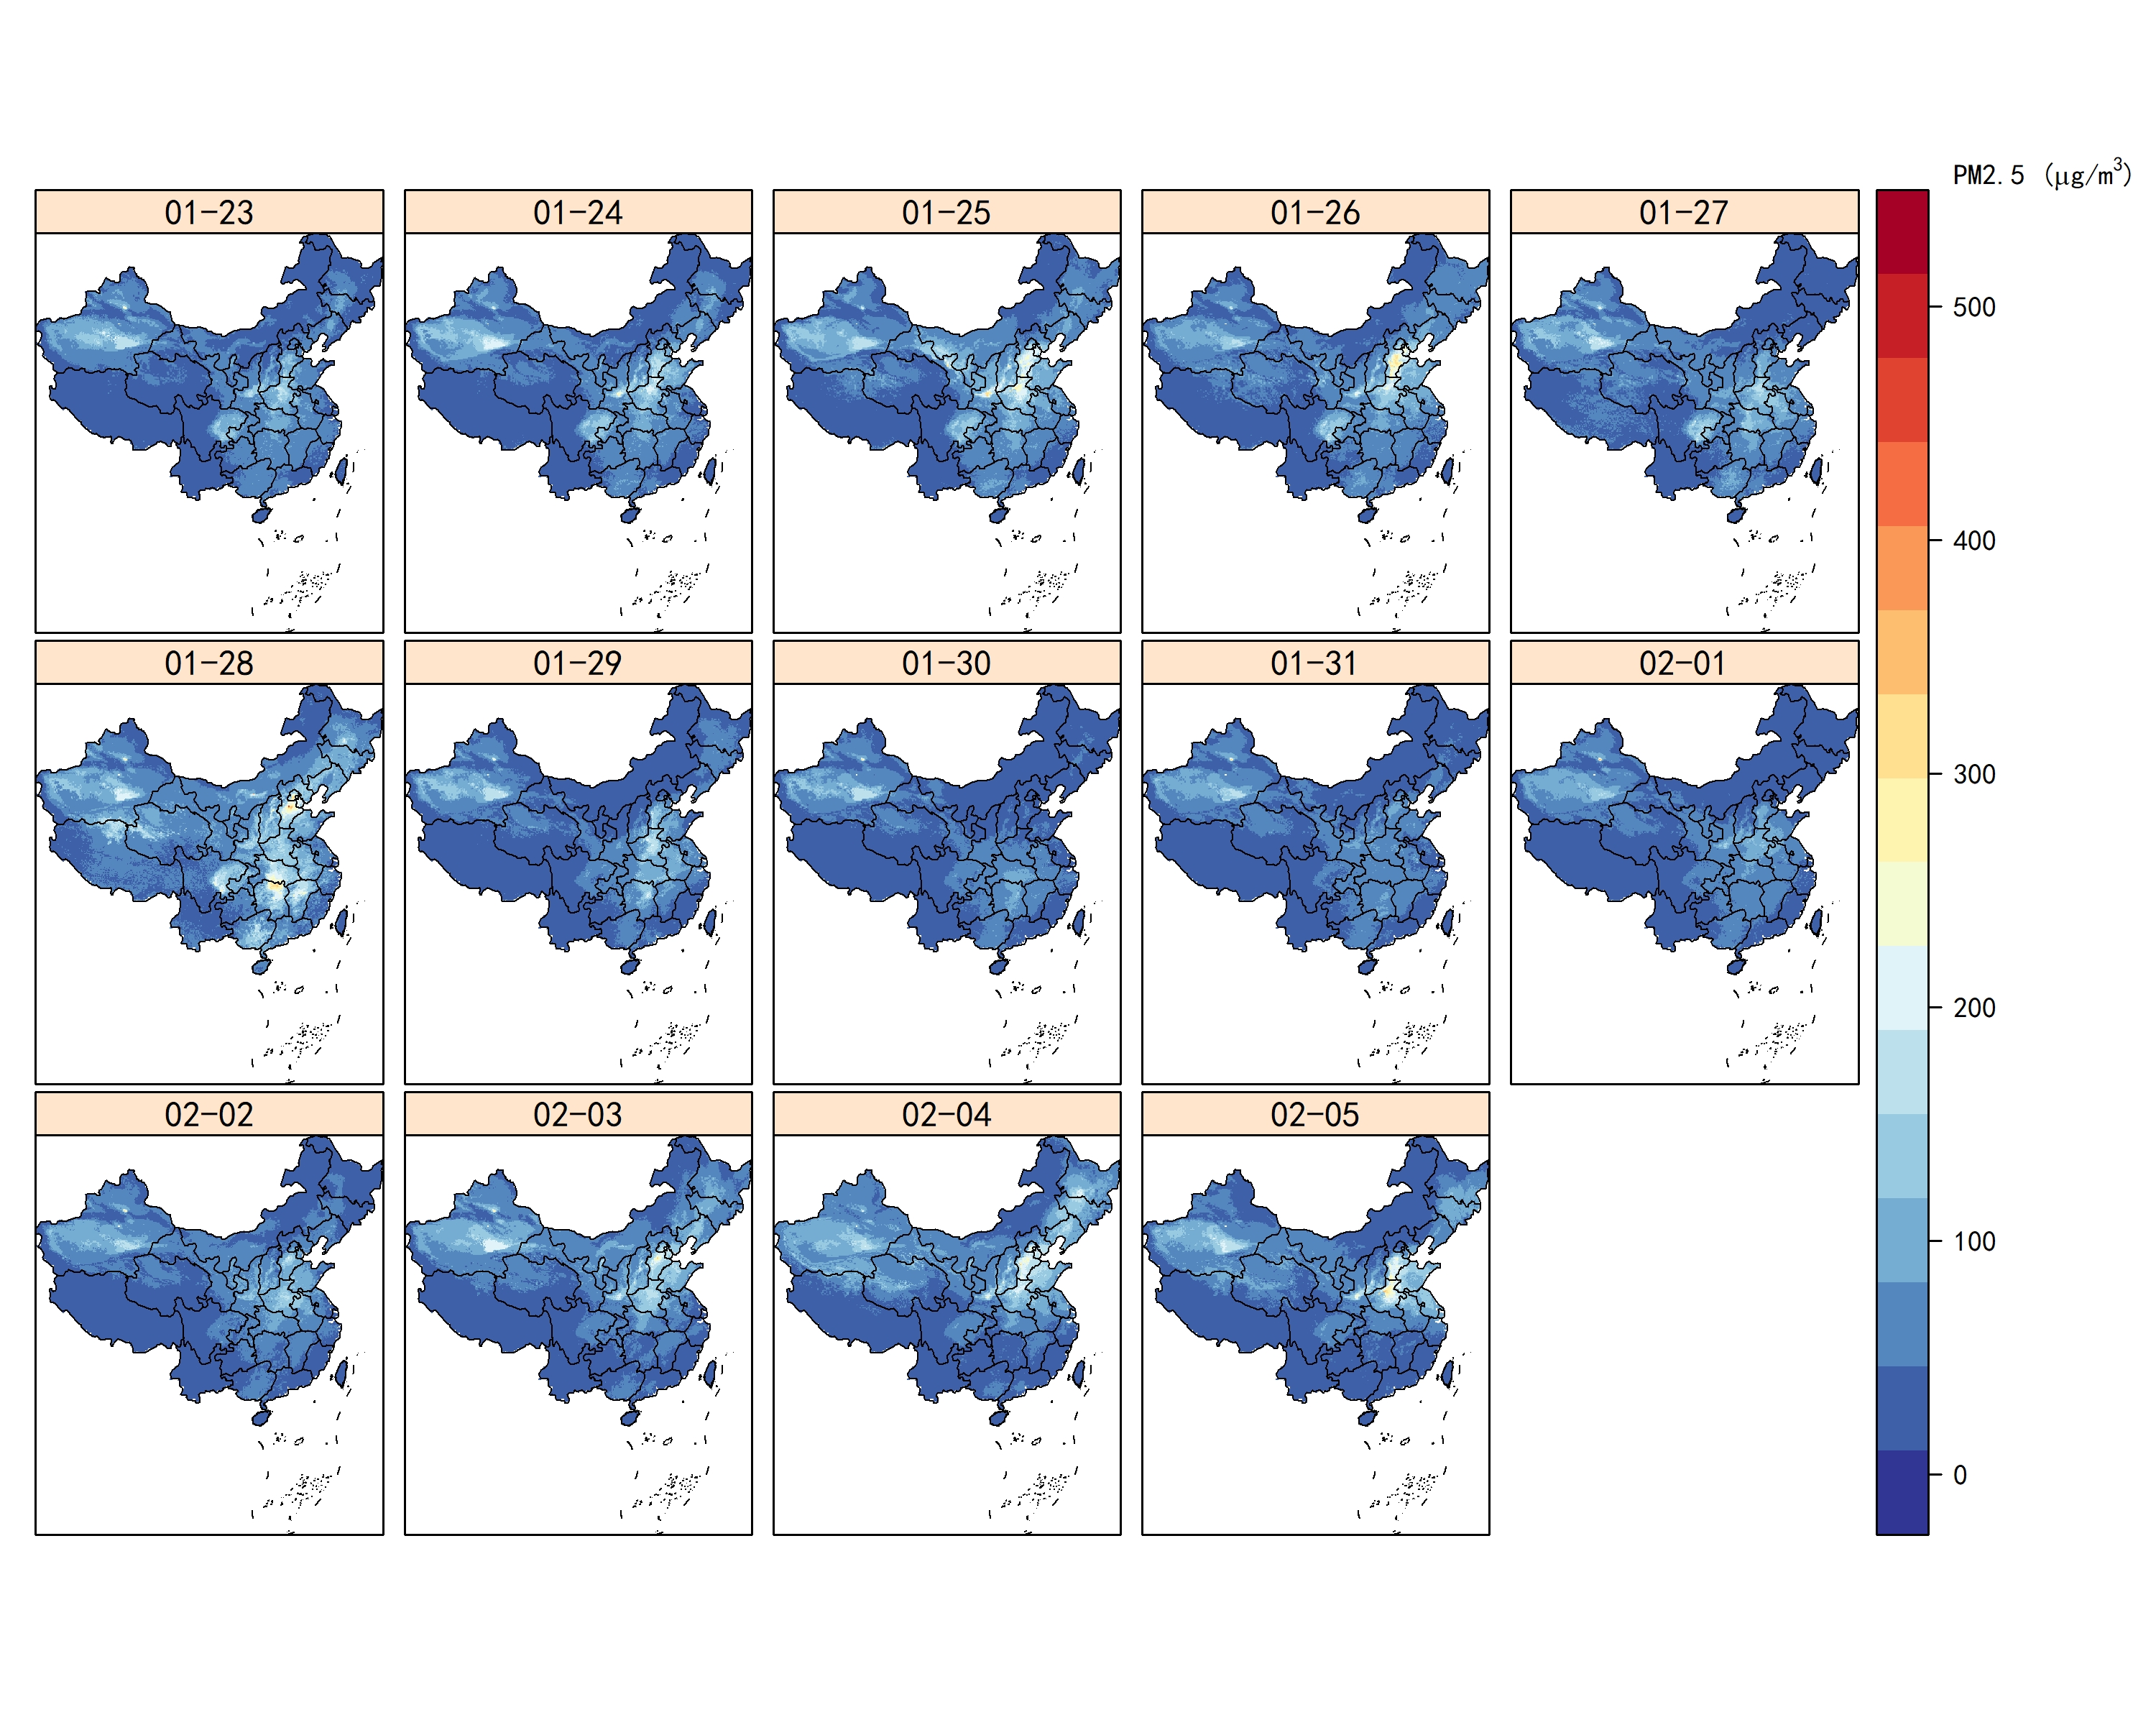
Figure 3. Daily level PM2.5 mapping at 1-km resolution.
The application was published in Shanghai Urban Planning Review (in Chinese)
3 Health effects of air pollution exposure
Accurate pollution maps enable individual-level exposure assessment. Based on the mapping products, we evaluated the short-term health effects of PM2.5 exposure during the Spring Festival in 25 Yangtze River Delta cities using the population exposure metric AF and OD matrices, and further extended the exposure–health chain to long-term chemical constituents and diabesity risks in a national cohort, as well as real-time blood pressure responses measured by wearables.
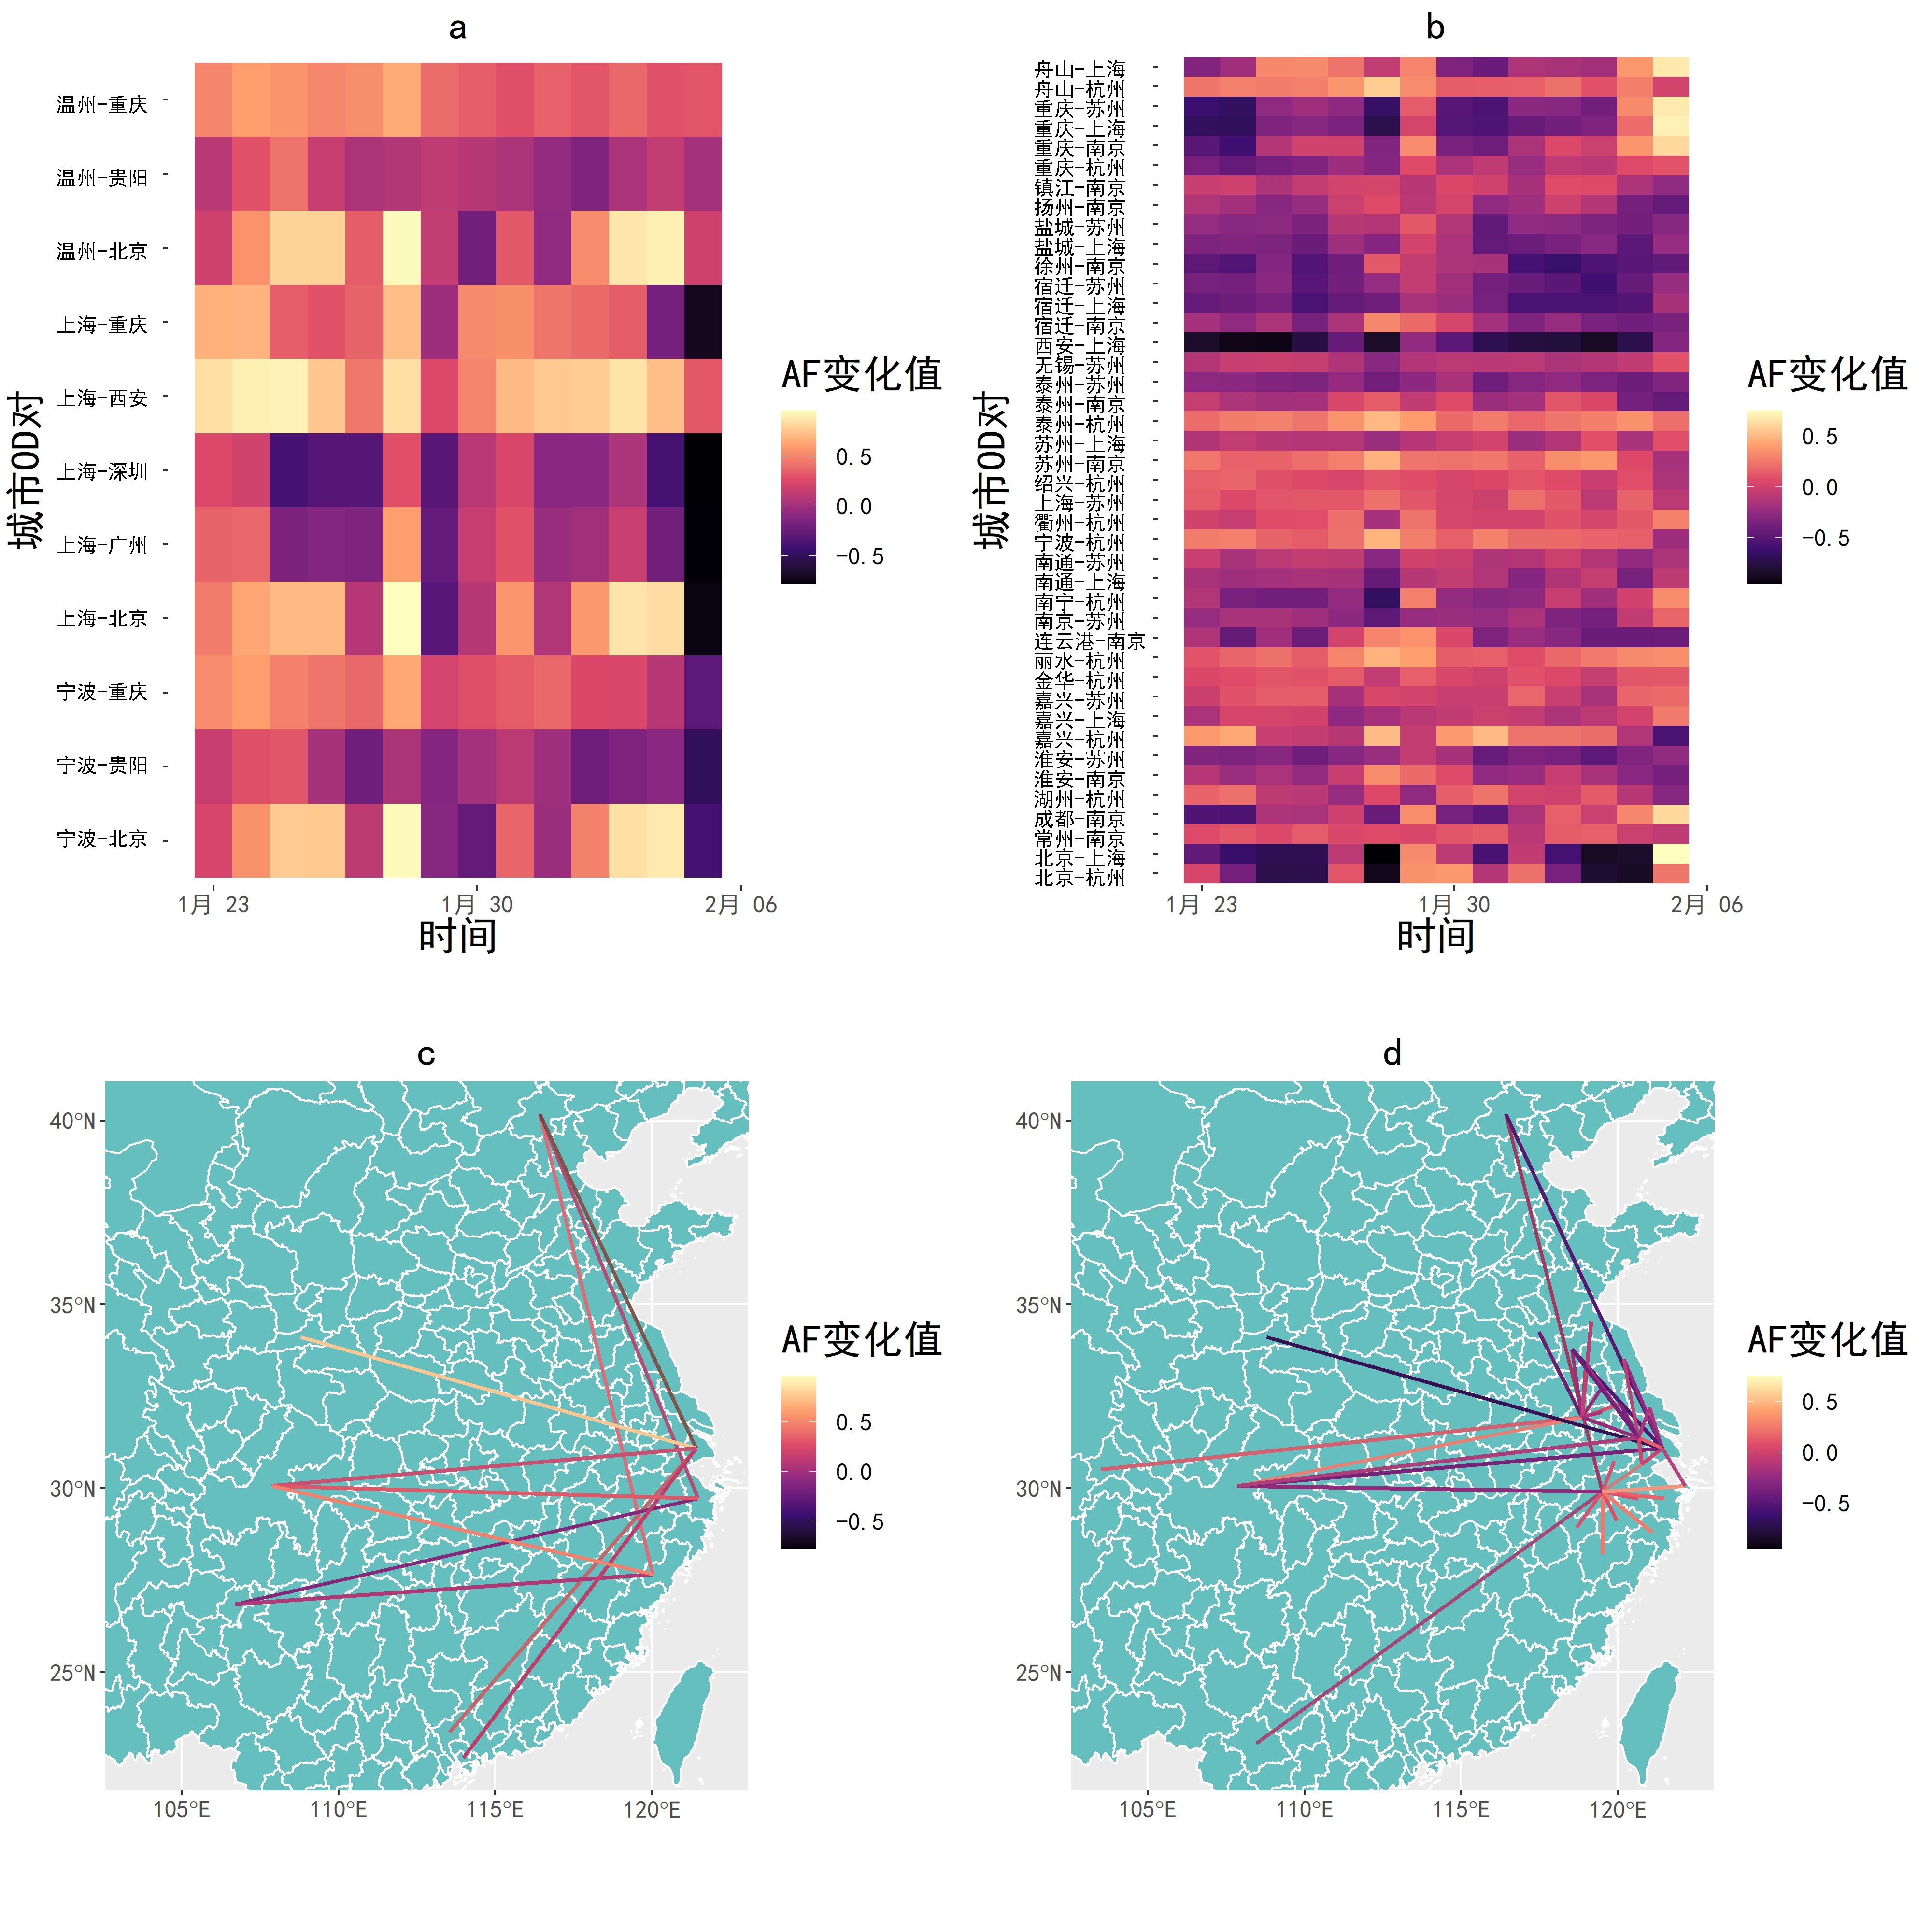
Figure 4. The time variation and OD matrices of AF.
【建成环境与行为研究】春节期间的PM2.5污染短期暴露健康效应评估——以长三角地区25个城市为例 | 上海城市规划
The cohort study was published in The Lancet Regional Health – Western Pacific, and the wearable study was published in Journal of Urban Health

Shaoqing Dai
Postdoc
Publications
The evaluation of health effect of short-term exposure to PM2.5 during spring festival: a case study of 25 cities in the Yangtze Diver Delta
Long-term exposure to PM2.5 chemical constituents and diabesity: evidence from a multi-center cohort study in China
Spatiotemporal patterns of air pollutants over the epidemic course: a national study in China
The Evaluation of Health Effect of Short-term Exposure to PM2.5 during Spring Festival: A Case Study of 25 Cities in the Yangtze River Delta(Chinese)
PM2.5 Spatiotemporal Evolution and Drivers in the Yangtze River Delta between 2005 and 2015
Individual and Interactive Influences of Anthropogenic and Ecological Factors on Forest PM2.5 Concentrations at an Urban Scale
Talks
The impact assessment of urban built environment on carbon-air-health nexus: a lifecourse perspective

The Evaluation of Health Effect of Short-term Exposure to PM2.5 during Spring Festival: A Case Study of 25 Cities in the Yangtze River Delta(Chinese)
The Environmental Effect of Urban Form on PM2.5, A Case Study of Beijing-Tianjin-Hebei Urban Agglomeration