Urban Blue and Green Space
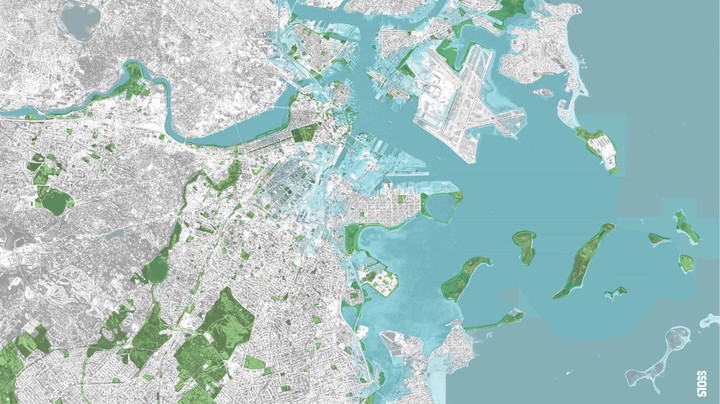
Urban blue and green space reduces the urban heat island effect, mitigates air pollution, and increases water yield, making it a core element of resilient and livable cities. This project examines urban blue and green space from both the water and the green side: stormwater simulation for sponge city planning, landscape patterns as driving factors of urban flooding, river network changes under urbanization, and the multi-perspective dynamics of urban green space during urban expansion.
1 Blue-green space and stormwater simulation for sponge city planning
In the new normal period of economic transition in China, the government proposed the Sponge City concept, and we hold some different views on sponge city planning. We extracted the impervious surface from the non-natural green infrastructure (NGI) landscape and used the precipitation-volumetric method to simulate waterlogging scenarios in Fuzhou, then linked the NGI landscape changes to the submerged areas through association rule mining. The simulation shows that submerged areas were characterized by high population densities and high levels of human activity, and spatial association rule mining revealed a strong association between areas converted from NGI landscape and submerged areas, providing suggestions for sponge city planning.
Table 1. Simulation results of storm water scenarios
| Simulated parameter | Scenario 1 | Scenario 2 |
|---|---|---|
| Storm intensity(L·S⁻¹·ha⁻¹) | 163.183 | 101.847 |
| Runoff(L·S⁻¹) | 5.342×10⁶ | 6.668×10⁶ |
| Submerged depth(m) | 3.943 | 4.055 |
| Maximum submerged depth(m) | 1.943 | 2.055 |
| Submerged area (km²) | 1.345 | 6.032 |
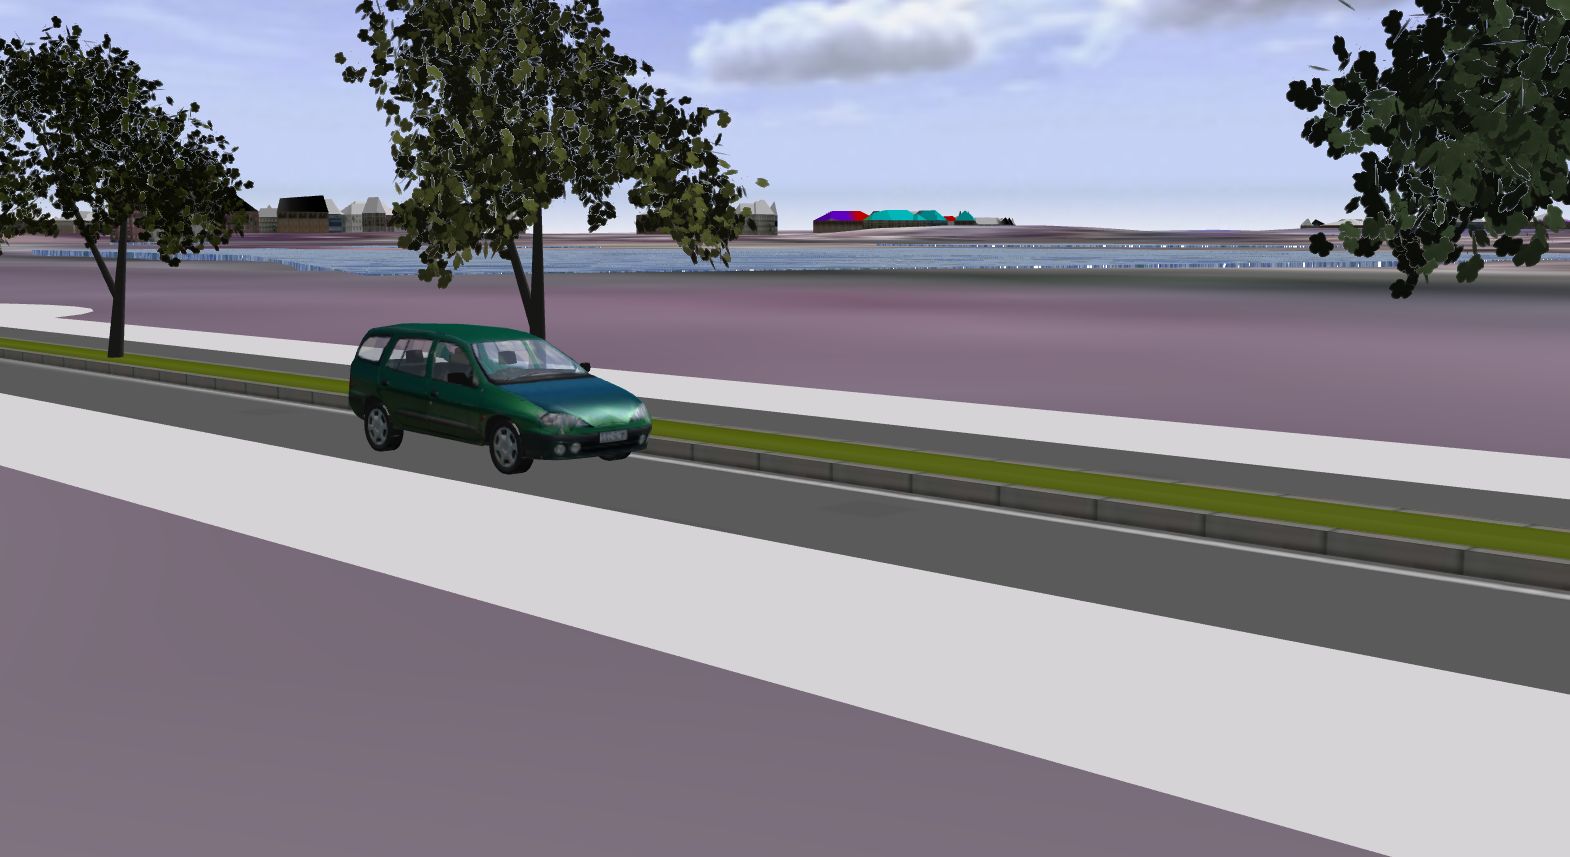
Figure 1. Visual representation of simulation results for scenario 1.
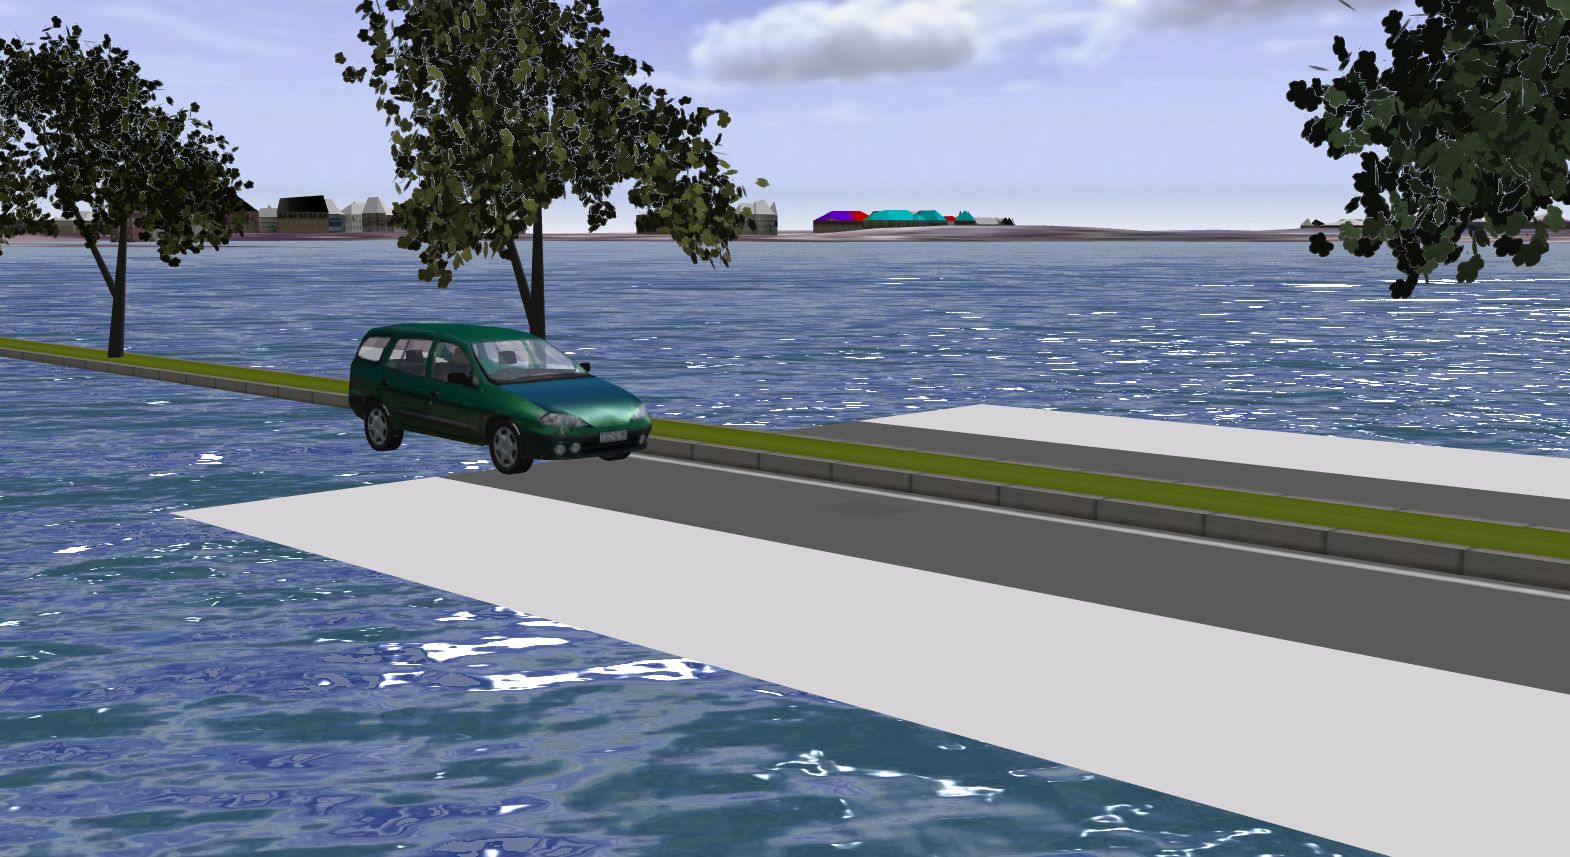
Figure 2. Visual representation of simulation results for scenario 2.
Table 2. Results of association rule mining
| Rules | Support | Confidence | Lift |
|---|---|---|---|
| Submerged=>Change | 0.002 | 0.212 | 1.655 |
| Stay=>No Submerged | 0.865 | 0.992 | 1.001 |
If an area was submerged, then the probability that the area was converted landscape was 21.2%; if an area was not subject to landscape conversion, then the probability that it would not be submerged was 99.2%.
The research also used multi-source data to identify urban ecological-production-living spaces and provided suggestions for urban resilience simulation optimization, developing ArcGIS toolboxes based on ModelBuilder and Python. Our results won the national third prize in the 2nd Big Data Supports Spatial Planning and Design Competition.
The chapter was published by ASCE
2 Landscape patterns as driving factors of urban flooding
Which landscape patterns drive urban flooding? We identified landscape patterns at different scales as driving factors for urban flooding in Guangzhou, showing that the composition and configuration of blue-green infrastructure significantly shape flood risk, and that multi-scale analysis is essential for capturing these relationships.
The paper was published in Ecological Indicators
3 River networks under urbanization
River networks are the skeleton of urban blue space. We assessed the variations in river networks under urbanization across metropolitan plains using a multi-metric approach, quantifying how urban expansion reshapes river density, connectivity, and morphology.
The paper was published in Land
4 Multi-perspective urban green space under urban expansion
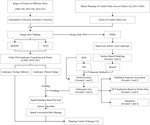
Eye-level greenery often diverges from what aerial indicators suggest. We introduced a multi-perspective framework integrating the aerial perspective (NDVI) and the human-centric perspective (GVI) with urban morphological, socioeconomic, and topographic indicators, revealing how urban expansion reshapes the spatial relationships between urban green space and urban morphology in Guangzhou.
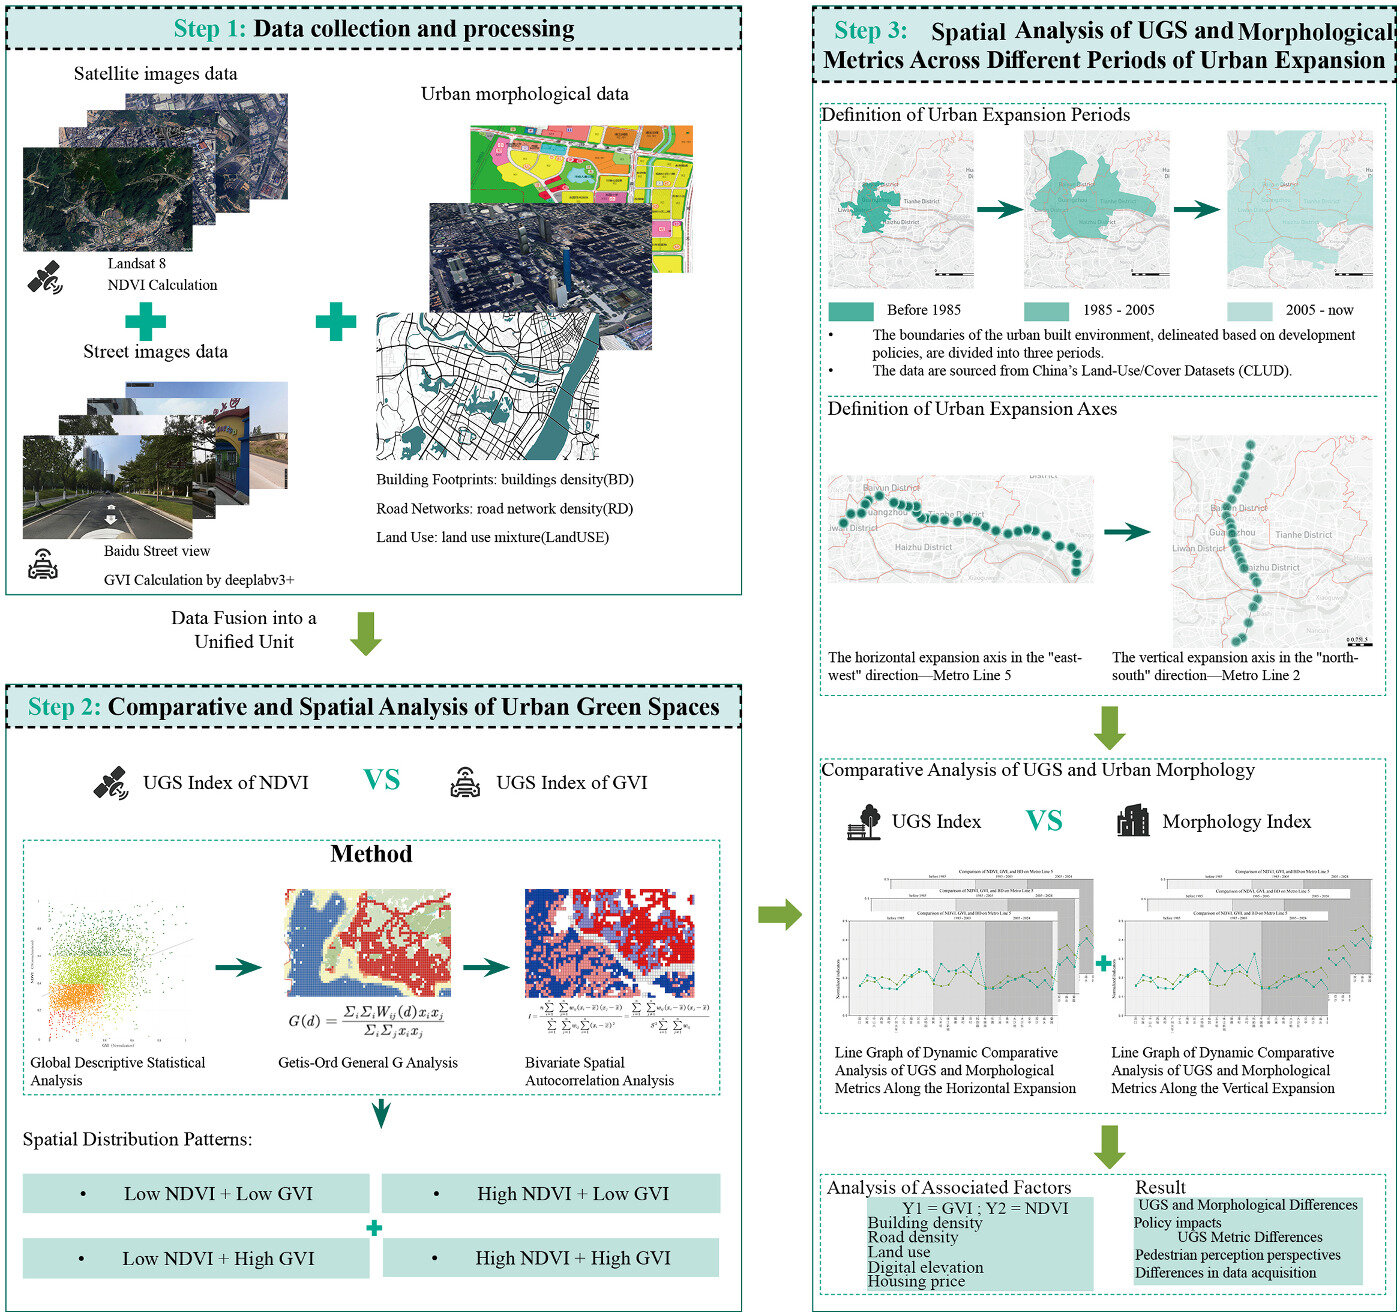
Figure 3. Research framework of the multi-perspective urban green space analysis.

Shaoqing Dai
Postdoc
Publications
Understanding multi-perspective urban green space patterns under urban expansion: Evidence from Guangzhou
Assessing Variations in River Networks Under Urbanization Across Metropolitan Plains Using a Multi-Metric Approach
Identifying landscape patterns at different scales as driving factors for urban flooding
The impacts of climate and land use/land cover changes on water yield service in Ningbo region(Chinese)
Determining the Mechanisms that Influence the Surface Temperature of Urban Forest Canopies by Combining Remote Sensing Methods, Ground Observations, and Spatial Statistical Models
Landscape-Scale Simulation Analysis of Waterlogging and Sponge City Planning for a Central Urban Area in Fuzhou City, China