Spatial Lifecourse Epidemiology
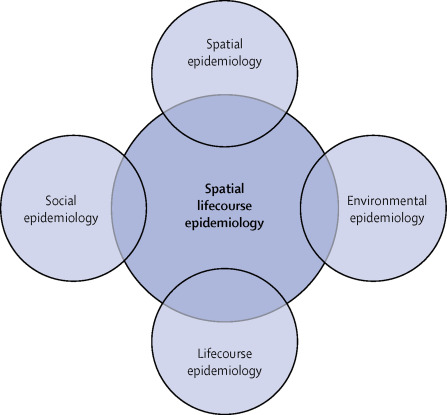
Spatial Lifecourse Epidemiology was proposed by my supervisor, Dr.Jia Peng in Lancet Planetary Health. Now it is also applied to infectious disease, especially the COVID-19 pandemic. It’s an emerging research field. There are the top 10 research priorities in Spatial Lifecourse Epidemiology and the Spatial Lifecourse Epidemiology Reporting Standards (ISLE-ReSt) statement publishing in the Journals. My Ph.D. project will focus on how to use the Earth Observation handling(Google Earth Engine), geospatial big data handling(Street View Image segment), and spatial statistics model to explore the health geography and spatial epidemiology problem. Our research interests include obesity, infectious disease like COVID-19, non-communicate disease, but not limited to these topics.
1 Obesity
We conducted a series of systematic reviews articles in Obesity Reviews to determine all the obesogenic environmental factors in childhood obesity.
2 COVID-19 Pandemic
2.1 COVID-19 research sources
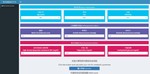
I built up a website about COVID-19 studies, Awesome of COVID-19. This website was used for collecting all the resources of COVID-19 related studies and was powered by docsite. Besides, I developed a dashboard shiny app about COVID-19 map, COVID-19 shiny app.

Figure 1. Snapshot of website “Awesome of COVID-19”

Figure 2. Snapshot of COVID-19 shiny app
2.2 Reverse of COVID-19
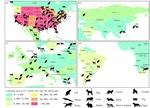
The coronavirus disease 2019 (COVID-19) pandemic can cause reverse zoonoses (i.e., human–animal transmission of COVID-19). It is vital to utilize up-to-date methods to improve the control, management, and prevention of reverse zoonoses. Awareness of reverse zoonoses should be raised at both individual and regional/national levels for better protection of both humans and animals.
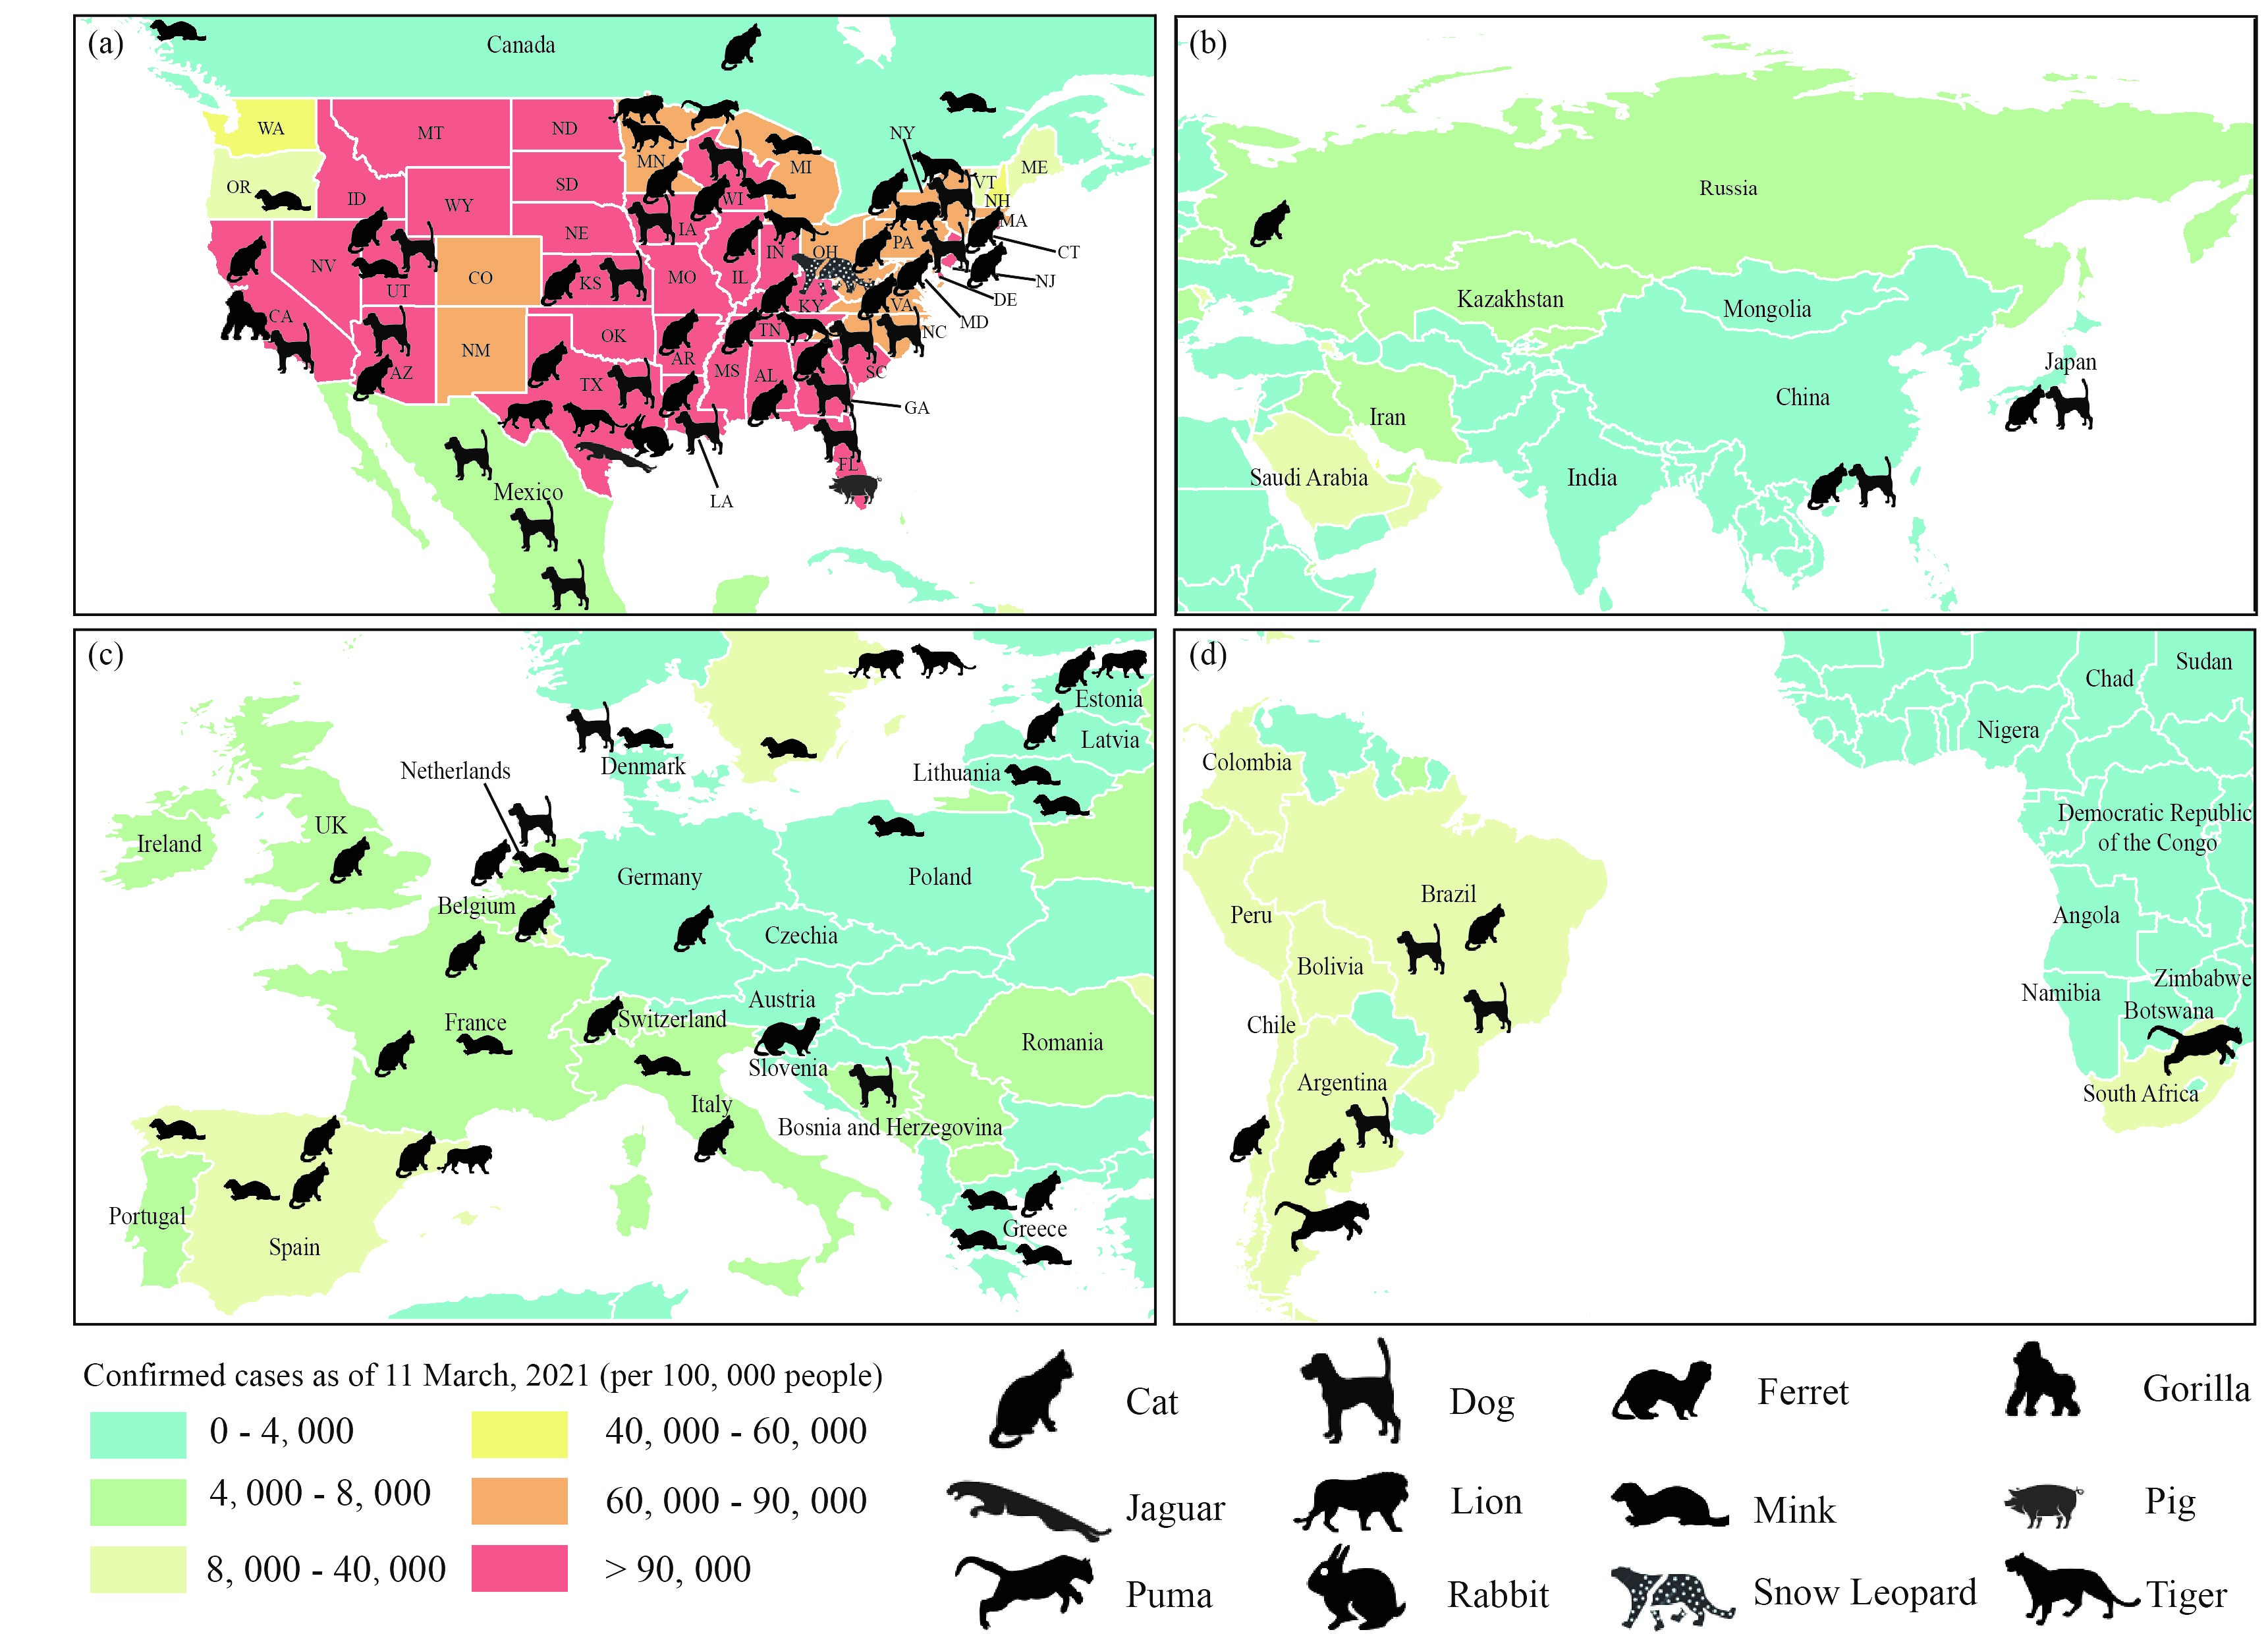
Figure 3. Coronavirus Disease 2019 (COVID-19) Natural Infections of Pet, Zoo, and Livestock Animals as of 11 March 2021 Mapped onto Number of Confirmed Cases in the Human Population.
Trends论文献策疫情中被忽视的“人-动物”感染风险 | Cell Press论文速递
2.3 COVID-19 epidemic prevention and control

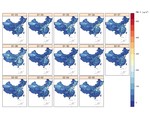
3 Health effect of exposure to air pollution
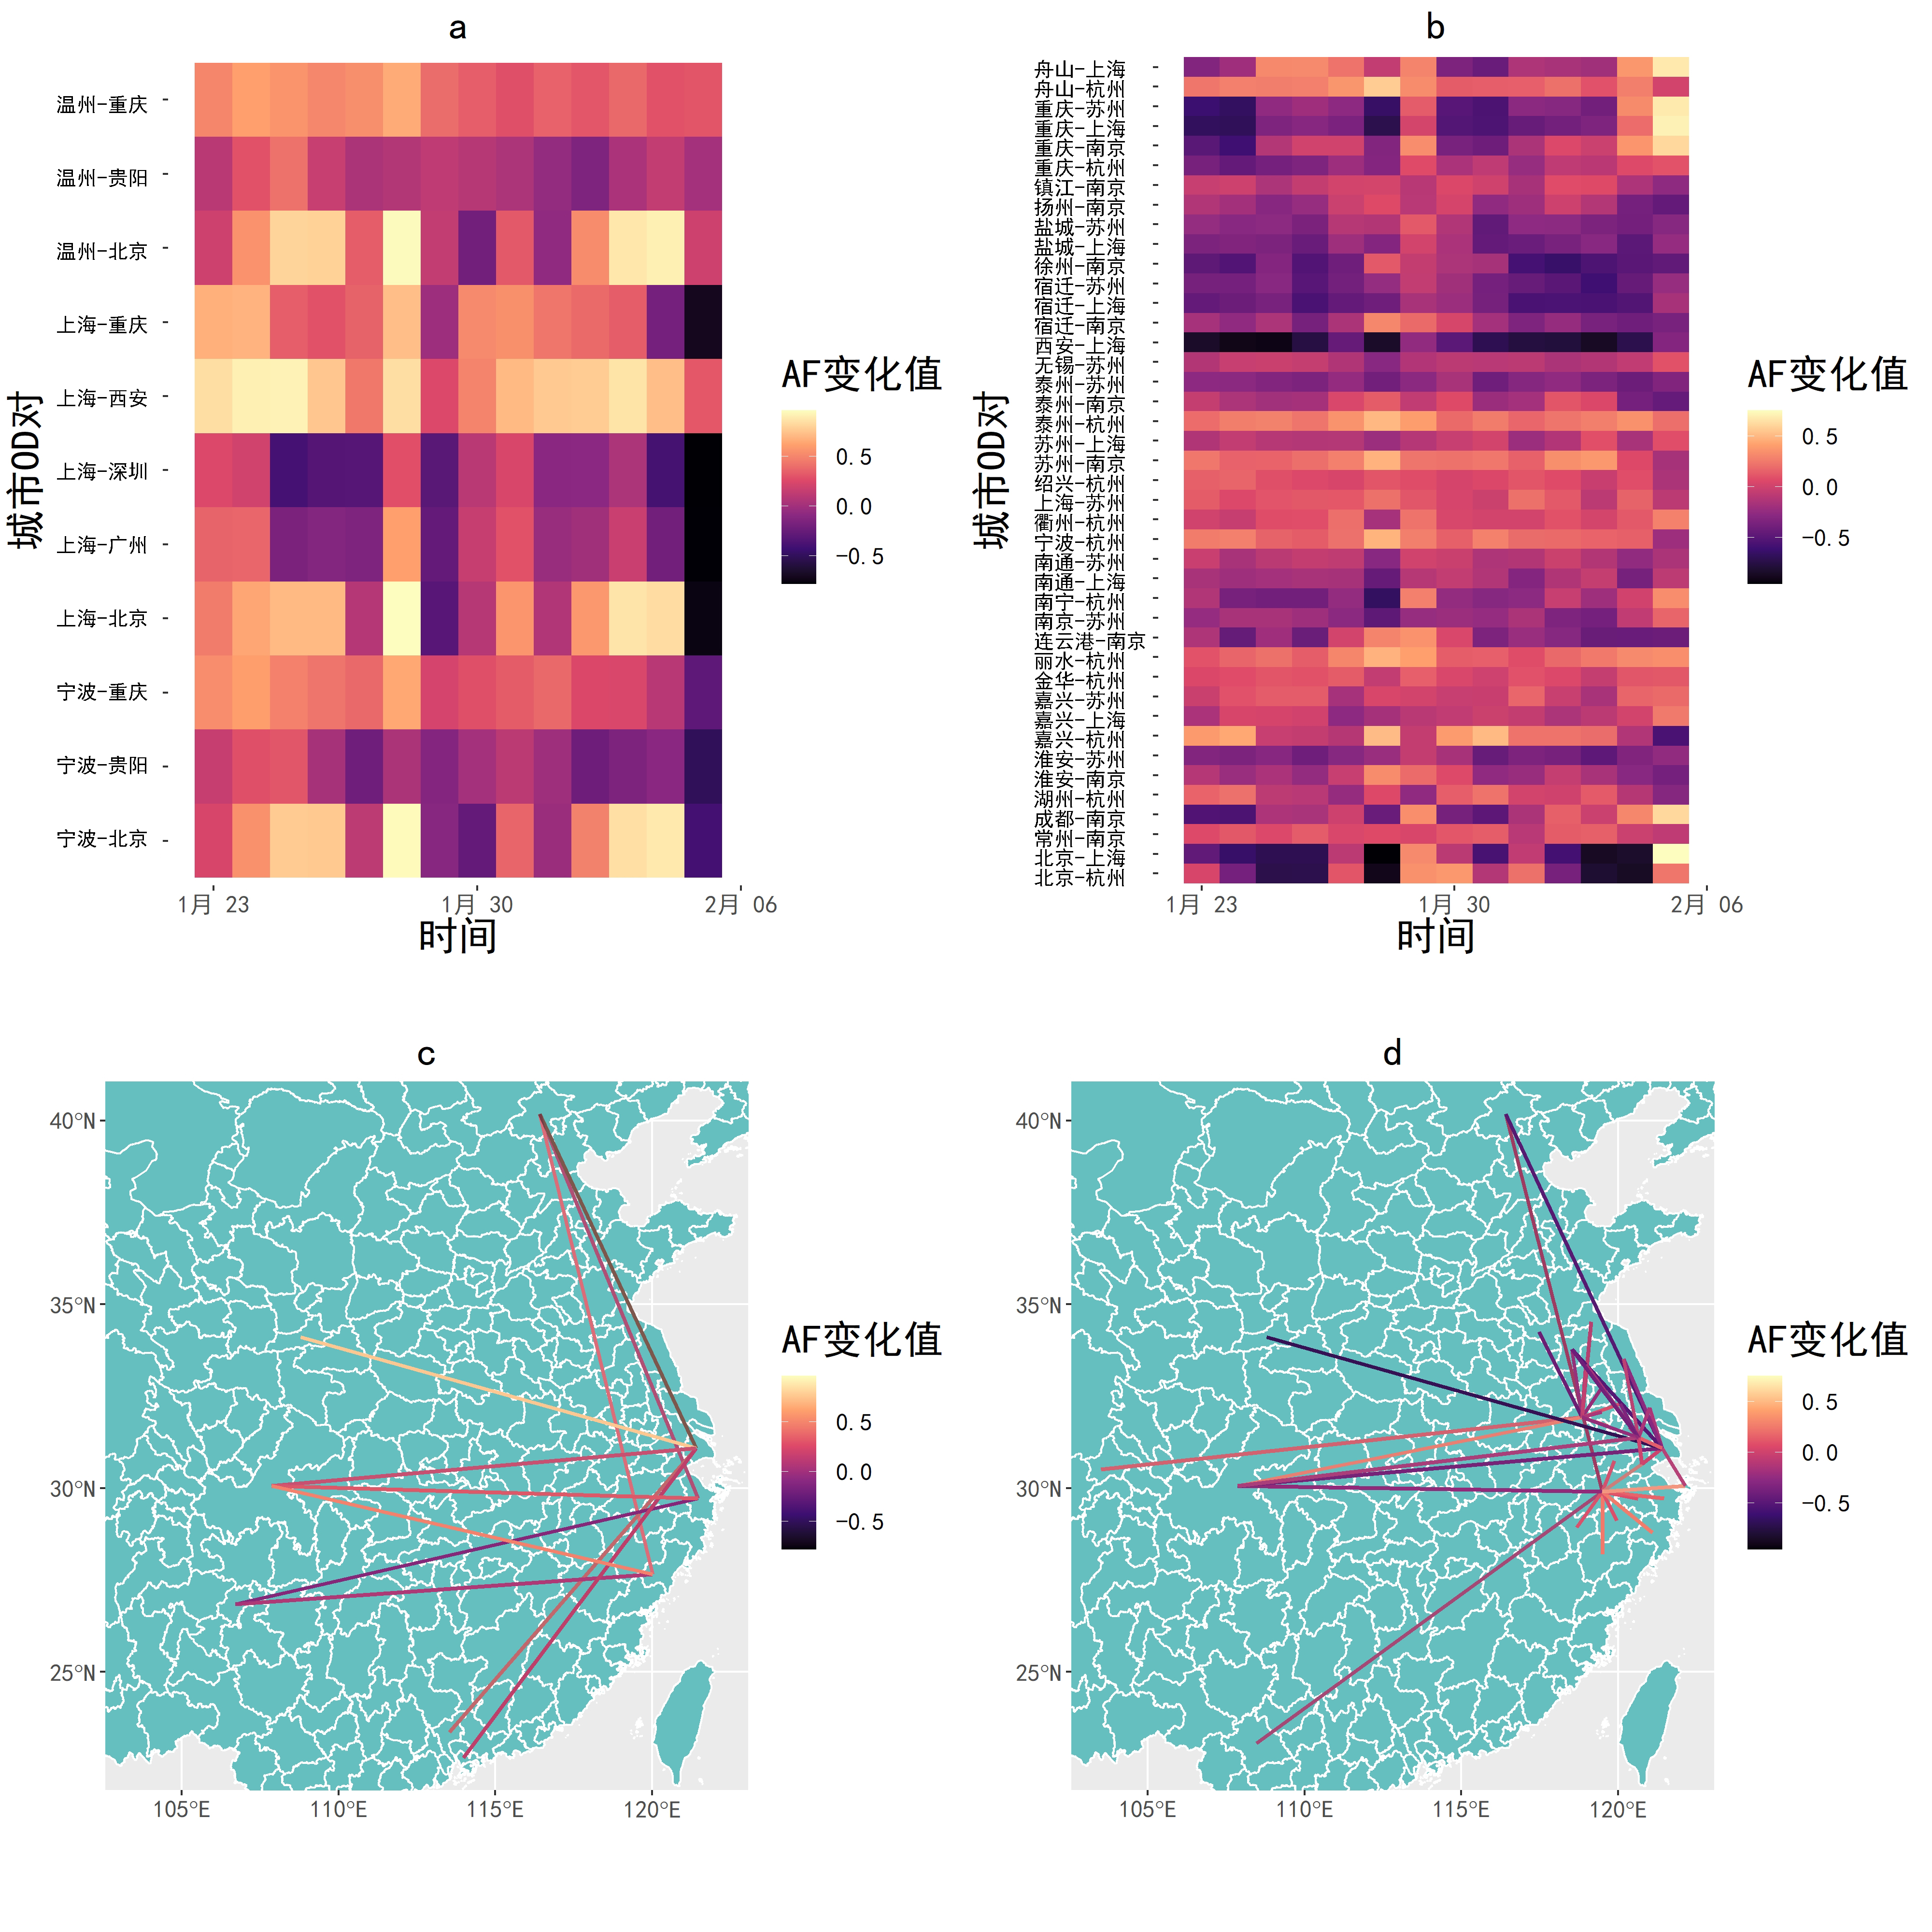
Figure 4 The time variation and OD matrices of AF
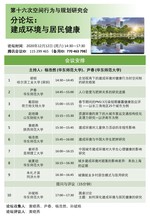
【建成环境与行为研究】春节期间的PM2.5污染短期暴露健康效应评估——以长三角地区25个城市为例 | 上海城市规划
4 Development of spatiotemporal physical activity opportunity using multi-source geospatial big data and machine learning
4.1 Bikeability
We develop a bikeability evaluation framework by combining the collected multi-source spatio-temporal big data.

Figure 5. The proposed bikeability framework.

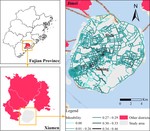
Figure 6. Average bikeability of Xiamen Island on December 21st, 22nd, 23rd, 24th, 25th, 2020, the roads highlighted in red indicate lower levels of bikeability, whereas those in green indicate higher levels of bikeability.

Figure 7. Average bikeability of Xiamen Island at 6:00, 7:00, 8:00, and 9:00 a.m., the roads highlighted in red indicate lower levels of bikeability, whereas those in green indicate higher levels of bikeability.
Shaoqing Dai
Ph.D candidate
Publications
Mixed land use has opposite associations with subjective well-being through social capital: Spatial heterogeneity in residential and workplace neighborhoods
Assessing spatiotemporal bikeability using multi-source geospatial big data: A case study of Xiamen, China
Development and validation of an age-sex-ethnicity-specific metabolic syndrome score in the Chinese adults
Environmental determinants of childhood obesity: a meta-analysis
Global spreading of Omicron variant of COVID-19
New Approaches to Anticipate the Risk of Reverse Zoonosis
Pitfalls in Modeling Asymptomatic COVID-19 Infection
The direct and interactive impacts of hydrological factors on bacillary dysentery across different geographical regions in central China
The Evaluation of Health Effect of Short-term Exposure to PM2.5 during Spring Festival: A Case Study of 25 Cities in the Yangtze River Delta(Chinese)
Natural environment and childhood obesity: A systematic review
Green space access in the neighbourhood and childhood obesity
Neighbourhood speed limit and childhood obesity
Access to bike lanes and childhood obesity: A systematic review and meta‐analysis
Talks
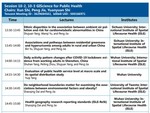
Health geography studies based on spatial lifecourse epidemiology framework
Seeking your interest and going ahead will contribute to success
Do neighborhood boundaries matter for examining the associations between environmental factors and obesity
The Evaluation of Health Effect of Short-term Exposure to PM2.5 during Spring Festival: A Case Study of 25 Cities in the Yangtze River Delta(Chinese)
What is geography? From coronavirus disease 2019 to Bei Dou Systems