Street view imagery-based built environment auditing tools: a systematic review
Abstract
The use of street view imagery (SVI) and advanced urban visual intelligence technologies has revolutionized built environment auditing (BEA) practice, by enabling high-resolution BEA at large scales. This study reviewed 96 studies of BEA published before October 2023. The Google SVI was employed in 92.7% of the included studies. Manual processing of SVI was used in BEA in most studies (81.3%), while deep learning methods were mostly used in the remaining studies. Validated auditing tools were used in 71% of the studies. Streets were the most frequently audited objects (54.2%), followed by sidewalk (51%), traffic (49%), and land use (34.4%). Objective attributes exhibited higher reliability in BEA, compared to subjective attributes (e.g. neighborhood environmental perception). The Active Neighborhood Checklist and Microscale Audit of Pedestrian Streetscapes were the two most widely used SVI-based BEA tools. Several key areas for improving the accuracy and reliability of SVI-based BEA were identified: building standardized datasets of built environment features for more accurate auditing, combining multi-source SVI for more comprehensive assessments, and adapting auditing tools to the contexts in developing countries. This study would contribute to a deeper understanding of built environmental influences on health, and facilitate informed decision-making in urban planning and public health efforts.
Systematic review Method
We used the PubMed and Web of Science databases to search for refereed journal articles. To identify articles related to BEA and SVI, we used two sets of search terms: (1) ‘built environment* audit’, ‘auditing’, and ‘virtual audit*’; (2) ‘streetview*’, ‘street view*’, ‘street-view*’, and ‘street view image*’. We collected all the papers published from the inception of the electronic bibliographic databases up to October 2023. We followed the Preferred Reporting Items for Systematic Reviews and Meta-Analyses (PRISMA) guidelines to conduct a systematic review (Moher et al. Citation2009), as depicted in Figure 1. Out of 429 initial results, we identified 96 eligible studies.

Figure 1. The flowchart that was followed when selecting and including studies on built environment auditing.
Characteristics of included studies
All included studies were published after 2010, marking a discernible increase trajectory in the annual number of publications over the past decade, as illustrated in Figure 2.

Figure 2. Number of the included studies published each year.
The vast majority of the studies (89 of 96, 92.7%) utilized Google SVI for BEA, while the remaining seven studies explored alternative SVI sources including Tencent SVI and Baidu SVI. Additionally, 13 studies employed other SVI sources, such as Bing Map, closed-circuit television, daum road view service, Google Earth, and Google Maps alongside Google SVI. In most studies (78 of 96, 81.3%), SVI was processed for BEA manually. Only 18 studies used computer vision and artificial intelligence technologies. Among these, deep learning techniques were particularly prevalent, employing convolutional neural network models like visual geometry group-16, visual geometry group-19, ResNet-18, SegNet, and DeepLab V3+. These models were specifically tailored for image segmentation tasks, offering fine-scale detection of eye-level objects, such as trees, sidewalks, and bike lanes.
BEA tools are defined as a range of developed toolsets or instruments utilized to audit and assess built environment attributes, including physical structures, facilities, and surroundings within a given study area, comprising both validated and unvalidated auditing tools. The validated auditing tools were defined as a series of commonly used auditing tools, which are based on well-established references and often implemented as platforms, toolsets, and frameworks. In contrast, unvalidated auditing tools are usually self-developed, lacking validation in other studies, and thus could only serve as conceptual methods without systematic implementation.

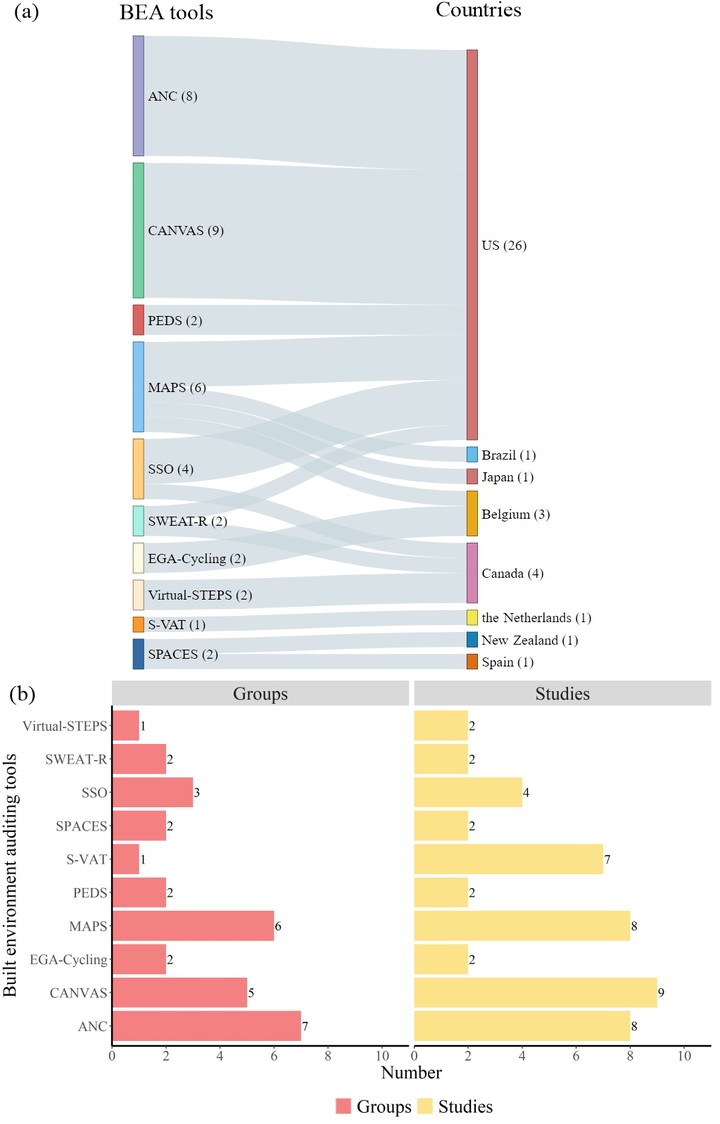
Figure 3. An overview of the studies using different built environment auditing tools in different countries, (a) represents the number of these tools within different countries (in parentheses), (b) represents the number of these tools that have been applied by different groups and in various studies.

Figure 4. The number of the included studies using different built environment auditing tools at different scales (in parentheses). Note: N—National; S—State (e.g. in the US) or equivalent unit; C—City; Cn—multicity; County—County or equivalent unit.
Frequently audited built environment attributes included street-related features (e.g. street lights, street parking, and streetscape aesthetics) (n = 52), sidewalk-related features (e.g. width, buffers, and continuity) (n = 49), and traffic-related features (e.g. signals, volume, public transit stops, and environment) (n = 47). Other notable attributes include land use (n = 33), facility-related features (n = 28), visual perceptions (e.g. aesthetics) (n = 25), and social environment (e.g. safety) (n = 16).

Figure 5. The count of studies auditing different built environment attributes.
Most studies (n = 64), undertook an evaluation of the reliability associated with the assessed built environment attributes.
The choice of indicators for audited built environment attributes differs among studies. Due to the ambiguity in some auditing characteristic definitions, the reliability and validity of gathered audit measures tend to be higher for objective attributes than subjective assessments. Among audited attributes, the presence of a sidewalk, a typical objective attribute, has the highest average reliability (0.837) across the majority of studies, exceeding the noteworthy threshold of 0.7 (as illustrated in Figure 6).

Figure 6. The average reliability indexes among different built environment attributes.
Implications for policy and practice
- Enhancing accuracy in quantifying built environment features
- Choosing a suitable SVI-based BEA method and enhancing robustness
- Addressing time lag and spatial limitations of SVI
- Bridging the BEA and urban exposome observation through SVI
Through a systematic review of the commonly audited built environment attributes and auditing tools, our findings provide a comprehensive understanding of the state-of-the-art SVI-based auditing approaches and offer insights into future directions for development. The reliability of these audits varies depending on the type of attribute and the assessment tool used. We have learned that objective attributes, such as the presence of a sidewalk, generally yield higher reliability, while subjective assessments may be influenced by auditor biases, resulting in lower reliability. The use of standardized auditing tools, such as S-VAT, across multiple cities demonstrates the potential for improved comparability and generalizability of research findings. Considering the number of research groups that used these tools, ANC and MAPS were identified as the two most widely accepted auditing tools. Furthermore, many standardized auditing tools have been exclusively implemented in specific countries. This is often attributed to auditing of those attributes that are relevant in these particular countries, which may not necessarily align with conditions found in other nations. Consequently, this localization of attributes has resulted in higher reliability when the tools are applied in the country where they were originally developed, as compared to their performance in other countries. The varying levels of reliability for different attributes within the same tool indicate the need for further refinement and standardization of assessment criteria.
The methodology’s merits lie in the adoption of a classification of auditing aims and the integration of various built environment features, ultimately allowing researchers to better understand the relationship between urban design and public health. The broader impact of these findings can inform urban planning and policy-making efforts to promote healthier and more sustainable living environments. Achieving higher reliability in built environment audits requires a careful balance between objective and subjective attributes and the adoption of standardized tools and assessment criteria. This can lead to more robust research findings and an improved understanding of urban environments, ultimately contributing to better-informed urban planning and policy decisions.