Spatial Lifecourse Health
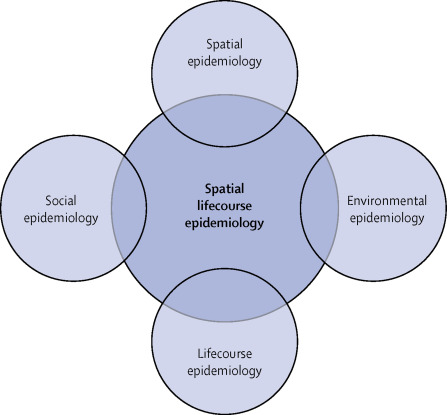
Spatial Lifecourse Health was proposed by my supervisor, Dr.Jia Peng in Lancet Planetary Health. Now it is also applied to infectious disease, especially the COVID-19 pandemic. It’s an emerging research field. There are the top 10 research priorities in Spatial Lifecourse Epidemiology and the Spatial Lifecourse Epidemiology Reporting Standards (ISLE-ReSt) statement publishing in the Journals. My Ph.D. project will focus on how to use the Earth Observation handling(Google Earth Engine), geospatial big data handling(Street View Image segment), and spatial statistics model to explore the health geography and spatial epidemiology problem. Our research interests include obesity, infectious disease like COVID-19, non-communicate disease, but not limited to these topics.
1 Obesity
We conducted a series of systematic reviews articles in Obesity Reviews to determine all the obesogenic environmental factors in childhood obesity.
2 COVID-19 Pandemic
2.1 COVID-19 research sources
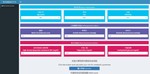
I built up a website about COVID-19 studies, Awesome of COVID-19. This website was used for collecting all the resources of COVID-19 related studies and was powered by docsite. Besides, I developed a dashboard shiny app about COVID-19 map, COVID-19 shiny app.

Figure 1. Snapshot of website “Awesome of COVID-19”

Figure 2. Snapshot of COVID-19 shiny app
2.2 Reverse of COVID-19
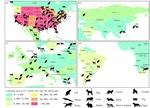
The coronavirus disease 2019 (COVID-19) pandemic can cause reverse zoonoses (i.e., human–animal transmission of COVID-19). It is vital to utilize up-to-date methods to improve the control, management, and prevention of reverse zoonoses. Awareness of reverse zoonoses should be raised at both individual and regional/national levels for better protection of both humans and animals.
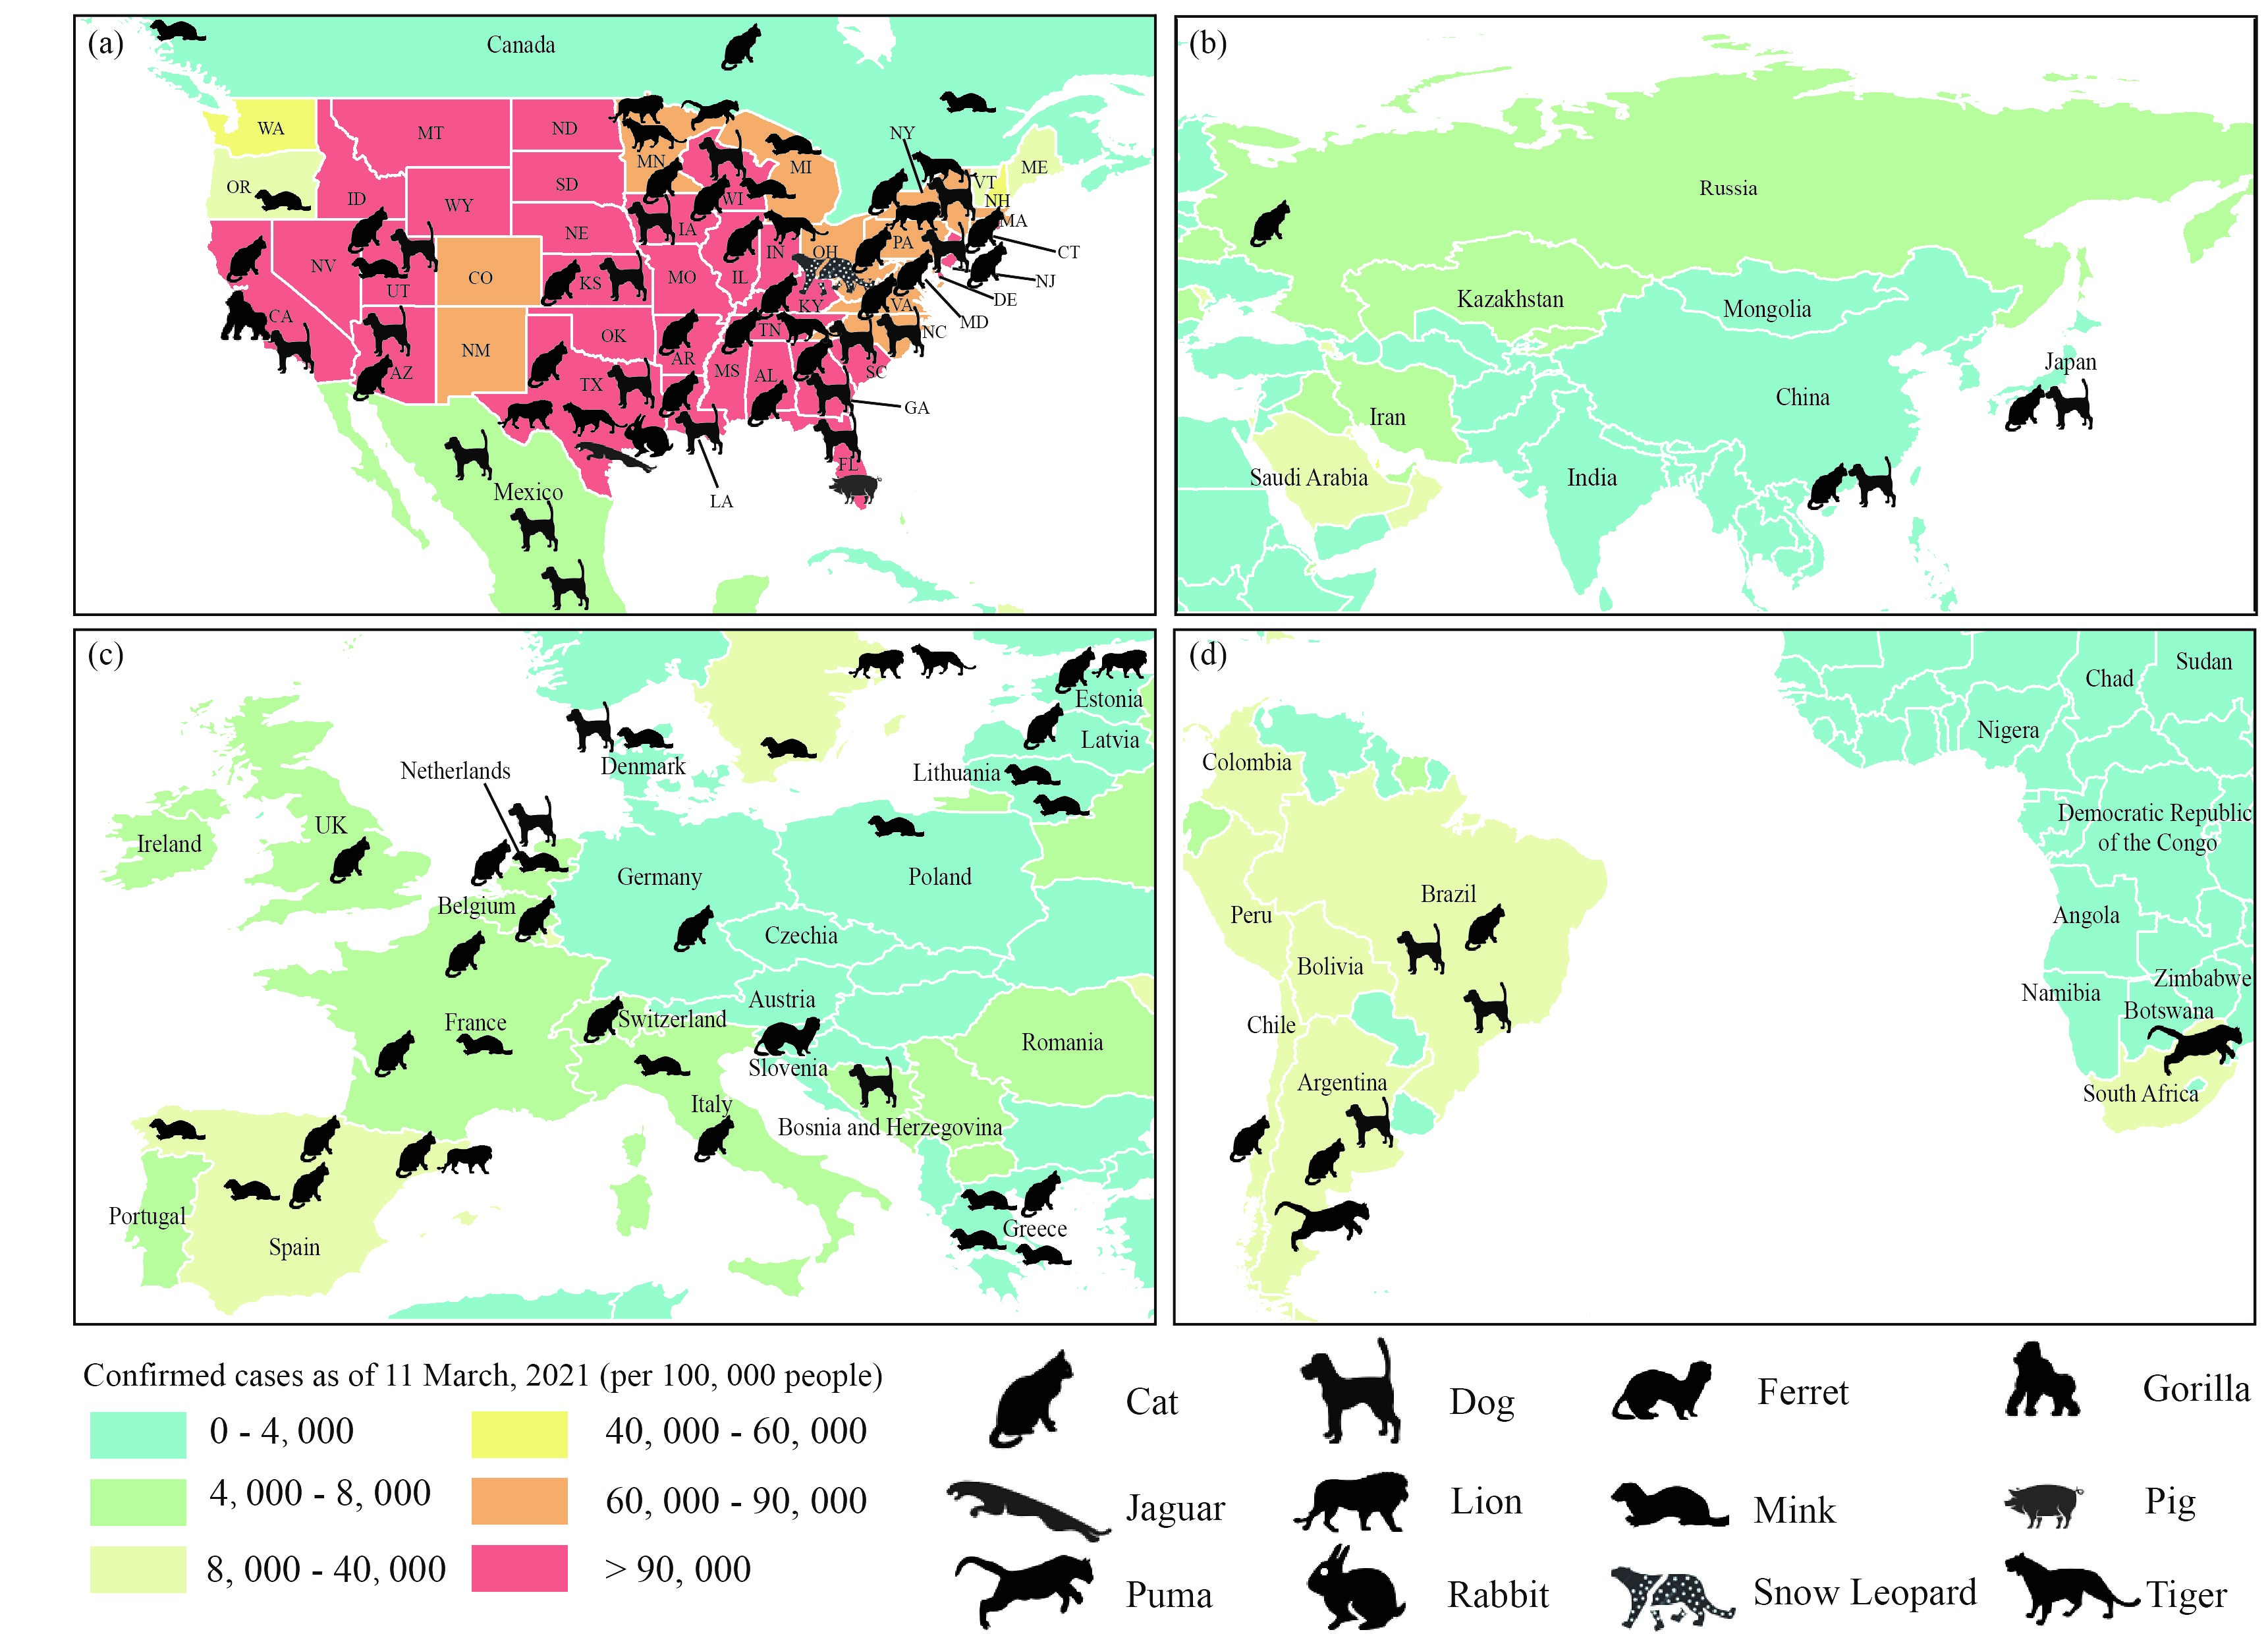
Figure 3. Coronavirus Disease 2019 (COVID-19) Natural Infections of Pet, Zoo, and Livestock Animals as of 11 March 2021 Mapped onto Number of Confirmed Cases in the Human Population.
Trends论文献策疫情中被忽视的“人-动物”感染风险 | Cell Press论文速递
2.3 COVID-19 epidemic prevention and control

2.4 Comprenhensive impact of COVID-19
Understanding the heterogeneous impacts of and vulnerability to COVID-19 could inform the design of environmentally sustainable and socially resilient cities, making them better equipped to encounter future epidemics. This study would help us identify more effective and equitable solutions to the ongoing challenges of the pandemic, promoting sustainability and resilience at multiple societal levels.
3 Health effect of exposure to air pollution
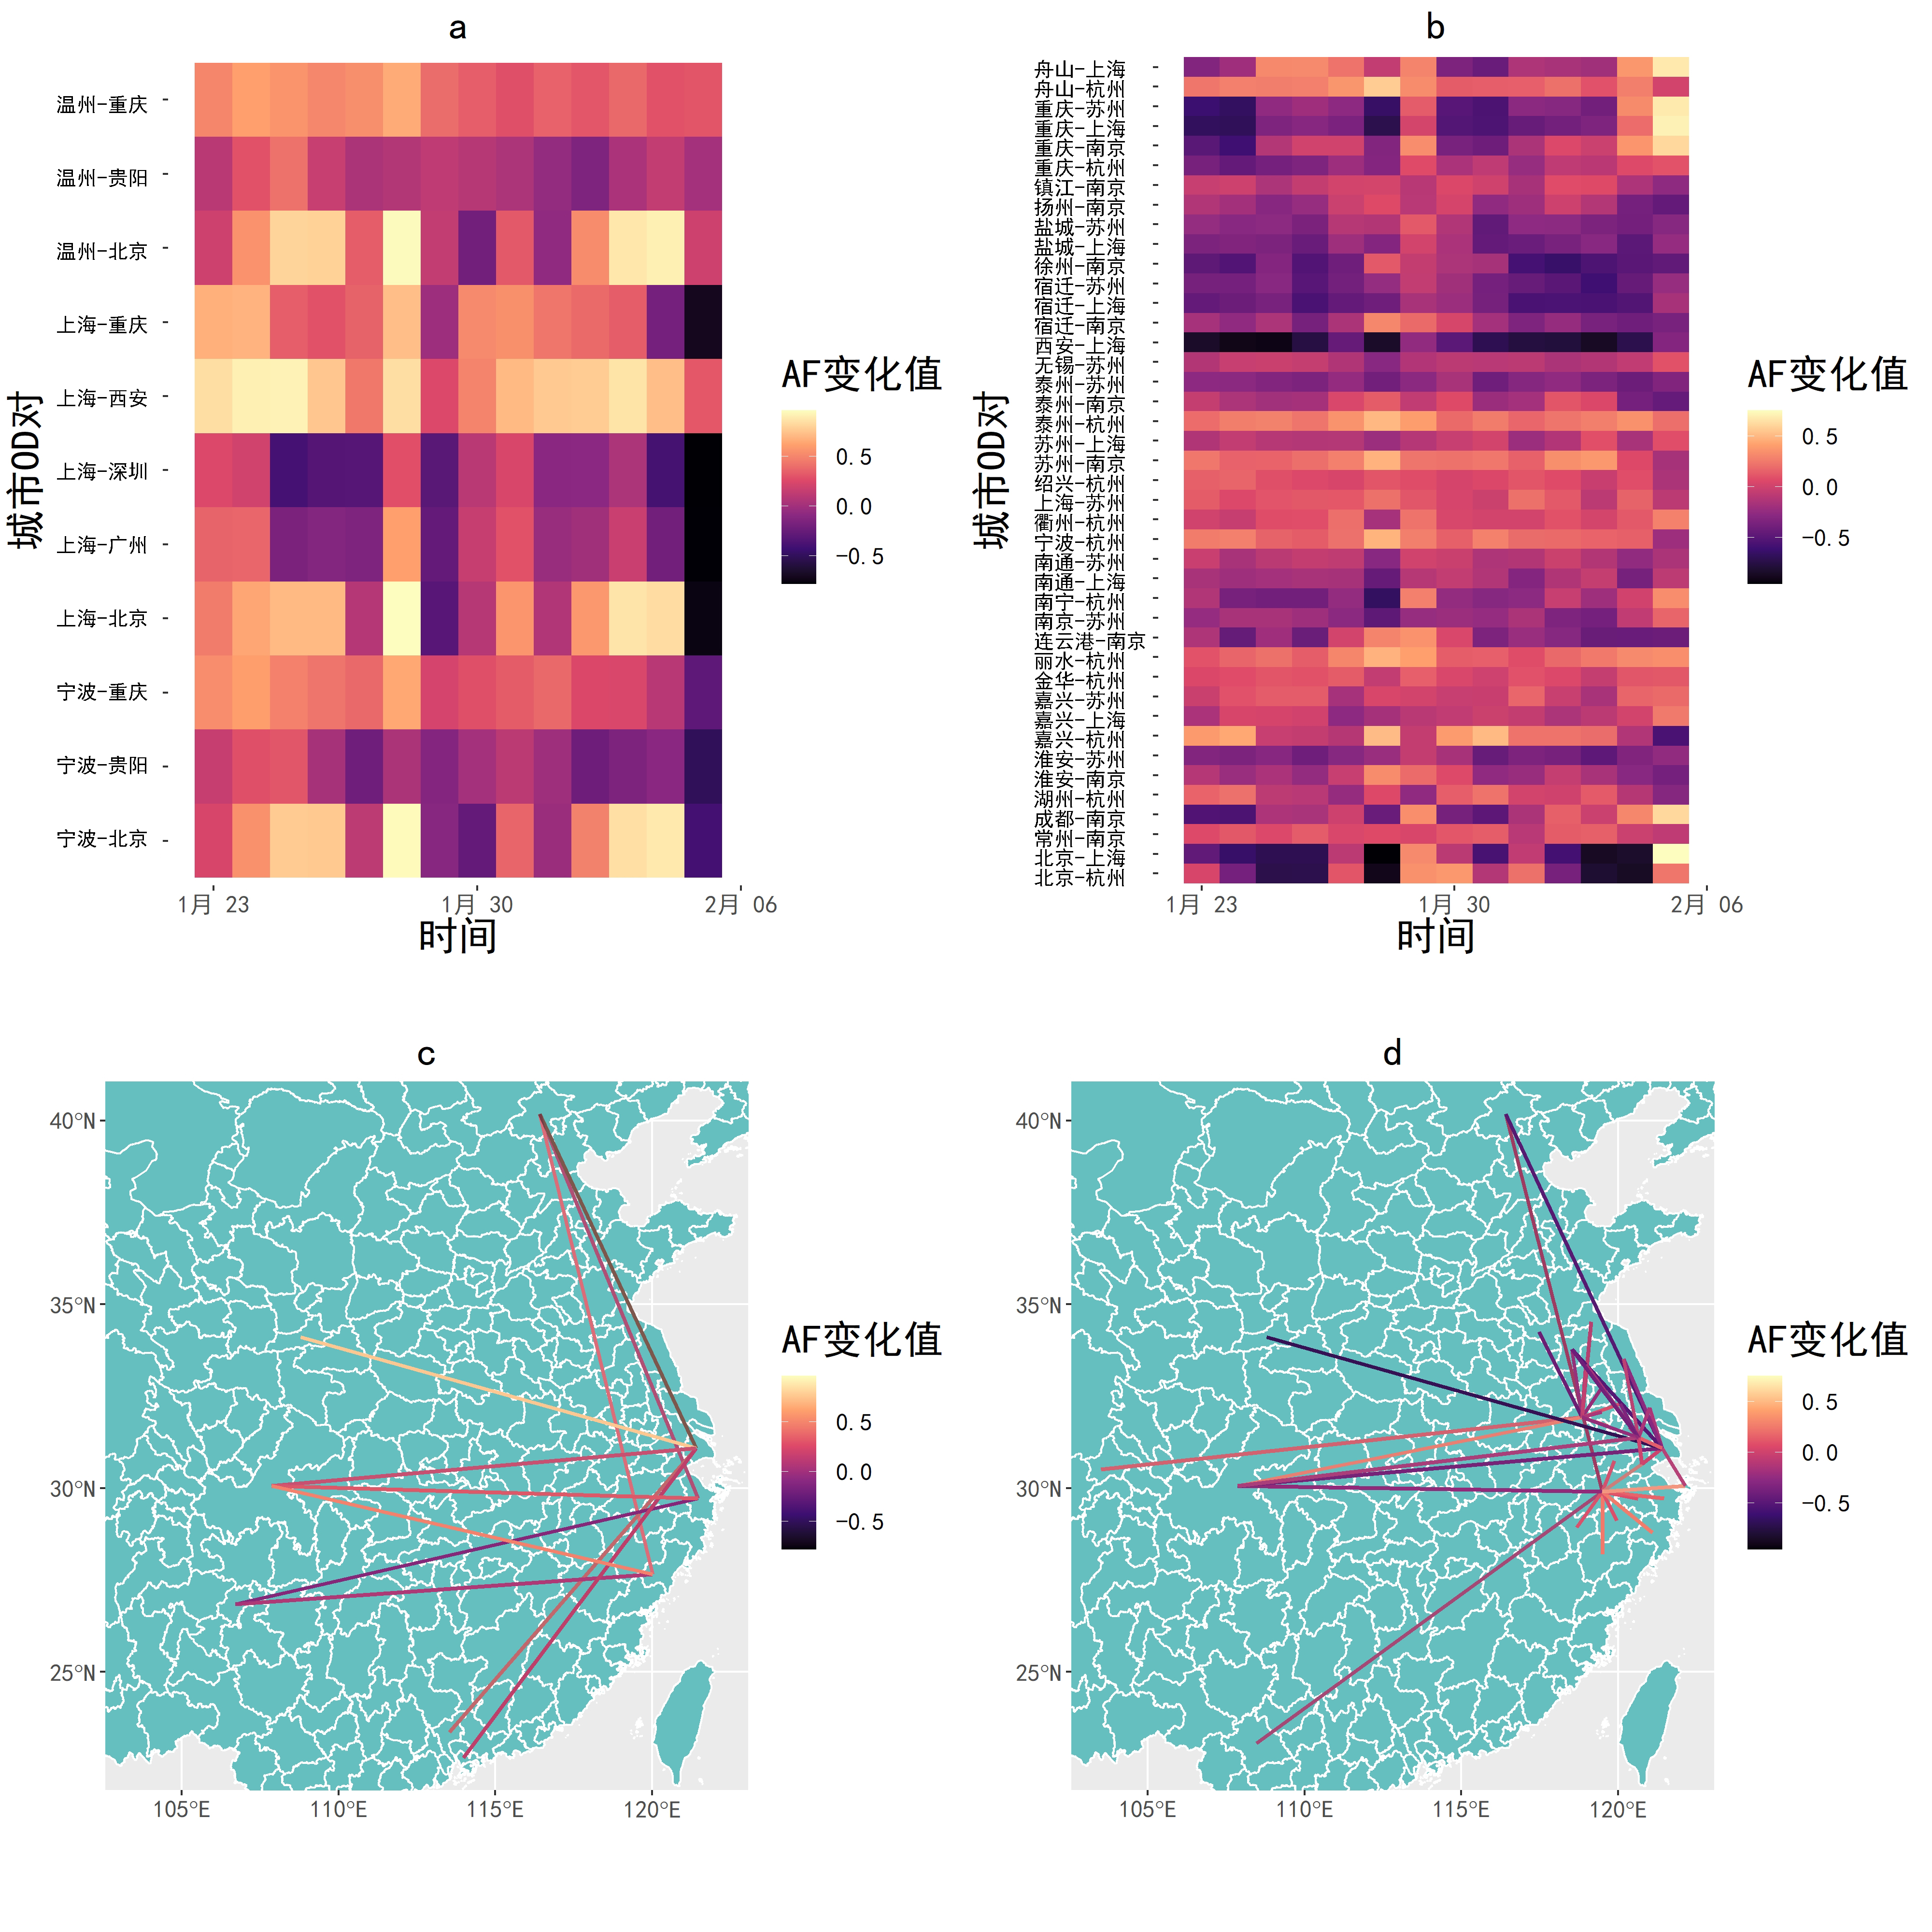
Figure 4 The time variation and OD matrices of AF
【建成环境与行为研究】春节期间的PM2.5污染短期暴露健康效应评估——以长三角地区25个城市为例 | 上海城市规划
4 Assessing obesogenic environment and spatiotemporal physical activity opportunity using multi-source geospatial big data and GeoAI
4.1 Built environment auditing
- Enhancing accuracy in quantifying built environment features
- Choosing a suitable SVI-based BEA method and enhancing robustness
- Addressing time lag and spatial limitations of SVI
- Bridging the BEA and urban exposome observation through SVI
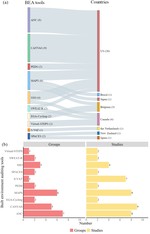
Through a systematic review of the commonly audited built environment attributes and auditing tools, our findings provide a comprehensive understanding of the state-of-the-art SVI-based auditing approaches and offer insights into future directions for development. The reliability of these audits varies depending on the type of attribute and the assessment tool used. We have learned that objective attributes, such as the presence of a sidewalk, generally yield higher reliability, while subjective assessments may be influenced by auditor biases, resulting in lower reliability. The use of standardized auditing tools, such as S-VAT, across multiple cities demonstrates the potential for improved comparability and generalizability of research findings. Considering the number of research groups that used these tools, ANC and MAPS were identified as the two most widely accepted auditing tools. Furthermore, many standardized auditing tools have been exclusively implemented in specific countries. This is often attributed to auditing of those attributes that are relevant in these particular countries, which may not necessarily align with conditions found in other nations. Consequently, this localization of attributes has resulted in higher reliability when the tools are applied in the country where they were originally developed, as compared to their performance in other countries. The varying levels of reliability for different attributes within the same tool indicate the need for further refinement and standardization of assessment criteria.
The methodology’s merits lie in the adoption of a classification of auditing aims and the integration of various built environment features, ultimately allowing researchers to better understand the relationship between urban design and public health. The broader impact of these findings can inform urban planning and policy-making efforts to promote healthier and more sustainable living environments. Achieving higher reliability in built environment audits requires a careful balance between objective and subjective attributes and the adoption of standardized tools and assessment criteria. This can lead to more robust research findings and an improved understanding of urban environments, ultimately contributing to better-informed urban planning and policy decisions.

Figure 5. An overview of the studies using different built environment auditing tools in different countries, (a) represents the number of these tools within different countries (in parentheses), (b) represents the number of these tools that have been applied by different groups and in various studies.
4.2 Bikeability
We develop a bikeability evaluation framework by combining the collected multi-source spatio-temporal big data.

Figure 6. The proposed bikeability framework.

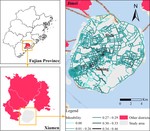
Figure 7. Average bikeability of Xiamen Island on December 21st, 22nd, 23rd, 24th, 25th, 2020, the roads highlighted in red indicate lower levels of bikeability, whereas those in green indicate higher levels of bikeability.

Figure 8. Average bikeability of Xiamen Island at 6:00, 7:00, 8:00, and 9:00 a.m., the roads highlighted in red indicate lower levels of bikeability, whereas those in green indicate higher levels of bikeability.
Shaoqing Dai
Postdoc
Publications
The evaluation of health effect of short-term exposure to PM2.5 during spring festival: a case study of 25 cities in the Yangtze Diver Delta
Effects of Short-Term Exposure to Air Pollutants on Real-Time Blood Pressure: A Wearable Device-Based Study in China
High-resolution population density mapping in urban areas using a contextualized geographically weighted neural network (CGWNN) model
Built environments and obesity: A framework considering residences, commute routes, and workplaces
Heterogeneous impacts of and vulnerabilities to the COVID-19 pandemic
Improving obesogenic environmental assessments with advanced geospatial methods
Long-term exposure to PM2.5 chemical constituents and diabesity: evidence from a multi-center cohort study in China
Street view imagery-based built environment auditing tools: a systematic review
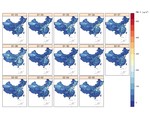
Spatiotemporal patterns of air pollutants over the epidemic course: a national study in China
State of the Art of Lifecourse Cohort Establishment
Mixed land use has opposite associations with subjective well-being through social capital: Spatial heterogeneity in residential and workplace neighborhoods
Assessing spatiotemporal bikeability using multi-source geospatial big data: A case study of Xiamen, China
Development and validation of an age-sex-ethnicity-specific metabolic syndrome score in the Chinese adults
Environmental determinants of childhood obesity: a meta-analysis
Global spreading of Omicron variant of COVID-19
Assessing bicycle-sharing riding friendliness by fusing multi-source heterogeneous spatio-temporal big data
Identification of two-dimensional copper signatures in human blood for bladder cancer with machine learning
Assessing riding friendliness by fusing multi-source heterogeneous spatio-temporal big data
New Approaches to Anticipate the Risk of Reverse Zoonosis
Pitfalls in Modeling Asymptomatic COVID-19 Infection
The direct and interactive impacts of hydrological factors on bacillary dysentery across different geographical regions in central China
The Evaluation of Health Effect of Short-term Exposure to PM2.5 during Spring Festival: A Case Study of 25 Cities in the Yangtze River Delta(Chinese)
Natural environment and childhood obesity: A systematic review
Green space access in the neighbourhood and childhood obesity
Neighbourhood speed limit and childhood obesity
Access to bike lanes and childhood obesity: A systematic review and meta‐analysis
Talks
Sensing healthy city based on multimodal data and GeoAI
Toward health geography: from the COVID-19 pandemic to Health China

Sensing healthy city based on multimodal data and GeoAI
Sensing healthy city based on street view imagery and GeoAI
Application of night light remote sensing data in urban studies
Sensing healthy city based on street view imagery and GeoAI
Sensing healthy city based on street view imagery and GeoAI
Sensing healthy city based on street view imagery and GeoAI
The impact assessment of urban built environment on carbon-air-health nexus: a lifecourse perspective
Development of the frequently used built environmental auditing and simulation tools in health domain
Development of the frequently used environmental exposome observation tools in health domain
Bridging environment and human health, from earth observation to human-center observation
Assessment of physical activity opportunities based on multi-source geospatial data
The frequently used built environmental auditing tools in the health domain
Health geography studies based on spatial lifecourse epidemiology framework
Seeking your interest and going ahead will contribute to success
Do neighborhood boundaries matter for examining the associations between environmental factors and obesity
The Evaluation of Health Effect of Short-term Exposure to PM2.5 during Spring Festival: A Case Study of 25 Cities in the Yangtze River Delta(Chinese)
What is geography? From coronavirus disease 2019 to Bei Dou Systems